Aggregate Method on Charts
Previous  Top  Next

The term Aggregate Method refers the way price and volume data are handled when daily prices are gathered into weekly, monthly or even longer-term aggregate files. These settings are included in UA Preferences. Click "Aggregate Method" to see your current setting and adjust as desired.

The Aggregate Method Screen:

aggregatecht


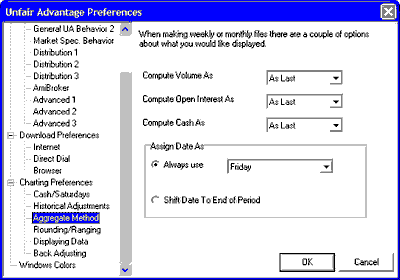
The Aggregate Method screen of Chart Preferences is very similar to the Aggregate Files tab of Portfolio Settings. The one that controls your current chart is determined by the creation method for this chart. Charts made from a portfolio listing use the settings that are defined for the specific portfolio. Charts made through the "New Chart" icon will use the specification on the Charting Preferences - Aggregate Method screen described here.

Compute Volume As
Compute Open Interest As
Compute Cash As


For each of these three, you may choose from:

·As Largest - to have your weekly, monthly or longer-interval charts include the ONE Largest value for the respective interval.  
 
·As Smallest - to have your charts use just the ONE smallest value for the defined interval.  
 
·As Average - to have UA calculate the average volume, open interest or cash for the respective week, month or longer term and include that value in your charts.  
 
·As Last - to have UA display the last volume, open interest or cash in your weekly, monthly, quarterly, semi-annual or yearly charts.  
 
·As Total - to have UA add all values for the respective interval represented by each price bar and use these totals in your charts. This choice can result in very large values that some analysis programs cannot handle. If your analysis program cannot process "As Total" results, please make another selection. The problem of very high values is most likely to occur for volume figures. Weekly, monthly and longer-term values for volume are normally presented as average daily volume, not total. The total volume can only be used if it will not be larger than 9,999,999. This choice is not available for cash prices.  
 
Assign Date As

 
The assigned date affects the dates represented on your weekly, monthly and longer-term price bars. Choose from:

·Always use (any of the five weekdays - Monday through Friday). Choose the day you want represented from the menu. UA will assign the corresponding calendar date for the given weekday throughout your chart. Note that no bar will display for incomplete periods. This means that if you have chosen to use Wednesdays for date assignment, a chart made on a Monday will end with the previous Wednesday's data.  
 
·Shift date to end of period. This choice will show the date as whatever is the end of the given weekly or monthly period, except possibly the final data point. Weeks will end on Friday and months will end on whatever day is the last business day of the month, but the final data point will always show the true ending date, which is the last date updated in your database.  
 
These apply to aggregate charts displayed on your screen. To switch between daily, weekly, monthly or longer-term price bars, use the "Bar Frequency" selection on the Right-Click menu.