Creating a futures option chart starts just as if you were charting the underlying futures contract. To create such a chart, begin by selecting the futures market or markets and making other common charting selections as described in the "Futures Charts" topic.
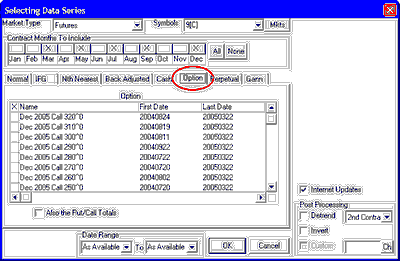
From the center region of the Selecting Data Series screen, click the "Option" tab, which is third from the right (see below). Our example shows a selection screen for CBT Corn, CSI #9, symbol C. We recommend that options be selected for one symbol at a time because of the variety of strike prices.
The "Selecting Data Series" screen displays:
Contract Months To Include
If you have entered only one symbol, your first customizable setting is the Contract Months To Include:
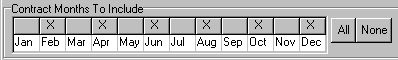
The selections represent the list of delivery months that UA will offer for you to choose from. It does NOT select these months for charting automatically. Because of the large number of options available for each market, you may want to select specific months for inclusion so that the list will be more manageable. No adjustments are required.
The default selections (those initially marked with an X) are the delivery months UA's Market Specs Factsheets identify as "normal" trading months. These are the active contracts that are normally traded over the course of the year. They are the ones listed as "V" (for valid) in the Active Months field of the Market Specs. Other months may be available. For example, the Market Specs may list some months as "S" (for switching month). If you want to add other months besides the active ones or delete selected months, click the box over the month. Click [All] at right if you want every possible contract to be available.
When multiple symbols have been entered, all normal, active delivery months will be selected automatically, and you will not have the choice of identifying alternative months.
Choosing Options
The "Option" screen identifies options by delivery month, put and call designation and strike prices. All are listed for the market(s) you have specified, subject to your choices above. The example below shows options for both CBT Corn (C) and Comex Gold (GC).
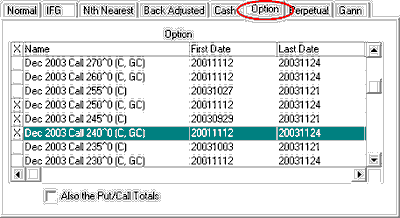
Click the first column for each option you wish to chart. Selected options are marked with an "X" as shown in the above example.
Keep in mind that if you have chosen multiple symbols, each "X" may represent multiple charts. The number of charts that can be charted simultaneously is subject to the charting limit specified as Memory Cache Size in UA Preferences.
Start and end dates are shown for each available series. The "Last Date" for current contracts reflects the date of your last daily update from CSI.
Scroll through the list using the bar at right to view all available contracts, including historical data of markets that have stopped trading.
Also the Put/Call Totals
Check the "Also the Put/Call Totals" box (click it) if you want to include a chart of put and call volume data for this market. (Not available for all markets.)
Common Settings
Neither Inversion nor Detrending is recommended for options. You may adjust the date range (if desired) as described in the "Futures Charts" topic before finishing your selection.
Click [OK] to display your chart(s).
See the Chart Interpretation & Manipulation chapter for information on managing your chart. Consider using the "Save to Portfolio" feature to save your charts for future use.