 To add Moving Average Convergence/Divergence (MACD) to any price series, simply make a chart of the desired series, click the "Indicator" button on the toolbar, and then select "MACD."
Alternately, pull down the Chart menu, click "Study Toolbar" and then select "MACD."
Slow Moving Average, Fast Moving Average, Exponential Moving Average:
These are the parameters used in creating the study results. When requesting an MACD study, it is usually advisable to take the default settings provided as used in the example below:
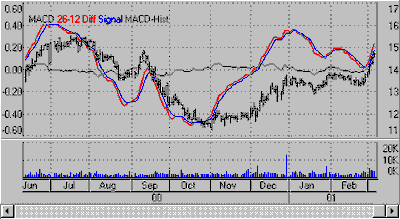
Three indicator lines are provided to explain the study results:
| · | The "difference line" is known as the MACD "fast" line. It is calculated as the numerical difference in price between the first two of the three exponentially weighted moving averages supplied as input defaults. (An exponential moving average is one where disproportionately heavy weight is assigned to the recent past.)
|
| · | The "slow Signal" line uses the third moving average period to measure the rate of change in movement of the difference line.
|
| · | Finally, the "histogram" line presents the difference between the blue and green lines. Although it is called the MACD-Histogram, it is shown as a line (rather than a histogram) to simplify the busy study results in an easier-to-read format.
|
Popular trading sentiment is that you should own a stock only when the difference line is above the signal line. If the difference line is below the signal line, a shorting opportunity may exist. Buy signals may occur when the difference line is below the midpoint and crosses above the signal line.
The most significant signals generated by the MACD indicator occur when the difference line and the and price trend diverge. The difference line is said to lead the way to the new market direction.
The "histogram line" is a recent addition to UA's MACD study. Users examine this line, watching for market movement down from a local peak. When it begins to fall from a peak, a sell signal is developing. Conversely, when the histogram line begins to rise from a trough, a buy signal is developing.
"Trading For a Living," by Alexander Elder, and published by John Wiley & Sons in 1993 is a good source of information and many other reports on technical indicators.