When a data series is overlaid, the default presentation is for both price series to use their own color-coded best-fit price scales, placed on opposite sides of the chart.
If you want both charts to share the single scale of the original chart, right-click your mouse anywhere on the chart and then click "Overlaid Series Shares Right Scale" from the menu. This scaling feature toggles on and off each time you click it.
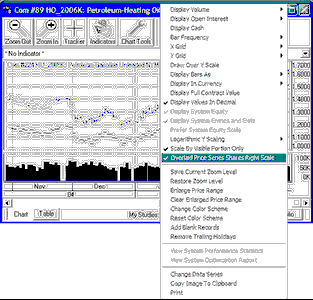
If the prices of the two charted series are so different that they will be incompatible on a single chart, this feature is not functional.