At the bottom of your UA chart is a pair of tabs offering "Chart" and "Table." The default presentation is of a chart, but you can easily view a numerical table of the data on your screen by clicking the "Table" tab.

The table view looks something like this:
The caret (^) figure seen in many prices indicates the divider between whole and fractional values. For example, the first Corn prices on this screen show an open cash price of 199^4. Since corn has a conversion factor of -1, it is represented in eights. This value represents 199 4/8.
Use the scroll arrows to view the entire file, as desired. You can switch back to the chart by clicking the "Chart" tab.
Copying tabular data to the clipboard
If desired, you can copy this tabular information to your computer's clipboard for use in other applications or documents. To do so, click the right (not left) mouse button to bring up the following menu:
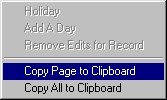
Click "Copy Page to Clipboard" to copy a text version of the rows currently displayed on your screen. To include the entire date range of the current file, click "Copy All to Clipboard." The text will be stored only until it is overwritten by the next image or text you place on the clipboard, or until you shut down your computer, whichever comes first.
To place this text into a document or program, first position and click your mouse at the desired location. Then click the "paste" button within your application program or hold down your keyboard's [Ctrl] key and type the letter V. Either of these techniques will paste the text into your current application.
Editing the Table
This UA table can be used for manually editing prices as described next. See Editing the Database in the Data Resources chapter for complete information.