

[Click here to return to journal index]
© Copyright 2003 by Commodity Systems Inc. (CSI). All rights are reserved.
Website Links: This CSI website and Unfair Advantage system contain hyperlinks and automatic links to websites operated by parties other than CSI. No association with or endorsement of third-party websites should be inferred through these links. They are provided for your convenience and reference only. CSI is not responsible for and has no control over the content of third-party websites.
|
June 2003
CSI Technical Journal Volume XXI, Number 6 |
Page 1 |
Topics discussed in this month's journal:
Holiday Schedule
CSI will be closed for voice communication on Friday, July 4th for the U.S. Independence Day holiday. Data from open markets will be available at the normal posting times, and the CSI host computer will be accessible as usual throughout the holiday weekend.
Expanded Focus Delays PDI (An update)
A NASA safety engineer recently reported, "If you don't have the facts, and you don't have the data, you don't have a chance." He was talking about finding the cause of the Columbia disaster, a formidable task, and one that we hope will be successful in preventing future tragedies. It occurred to me that this sentiment could be said of all complex problems. It is even true of our more modest efforts in revamping the Probable Direction Index (PDI).
We find ourselves in the enviable position of possessing great quantities of facts and data, but still somewhat overwhelmed in finding ways to process it all. UA provides virtually all of the facts and data that exist for nearly all world markets. Given that, we know we have an excellent chance of developing a system that makes outstanding trading recommendations. It is just taking a little longer than we might like. The delay in releasing the new PDI is attributable to a greatly expanded overall market focus.
In the three months since we announced that we would soon be publishing results derived from revisiting the principles of QuickTrieve's PDI, we have been deluged with possibilities. The depth and breadth of coverage offered by Unfair Advantage make wading through hundreds or thousands of possibilities exacting and time-consuming work.
The original PDI was a simple attempt to take widely published factors (available to every trader) and use them to forecast future market direction. We are still working on that original idea, but with a goal to incorporate the many new features, facts and fundamentals that were unavailable when QuickTrieve was our mainstream retail product. These new ideas do not change the fundamental nature of PDI. However, the discovery of many independent factors that can also enhance trading accuracy and strategy will allow the new formulation of PDI to become more powerful than ever. Getting it right takes time and substantial study.
Since we made the recent announcement about revisiting PDI, old-time PDI lovers (some of whom have been with CSI for more than 25 years) have come forward with their experiences and praise for that original product. They have suggested examples that they found to be helpful, and we have looked over their reports to see what has contributed to their successes over the years. We have been moving forward with this new application, but because of vastly improved technology within Unfair Advantage, we have been somewhat slow in sorting out the many likely benefits offered by Unfair Advantage's massive repository of additional facts and data.
The mathematical procedure used to forecast the future price of a given commodity or stock monitors the ongoing predictive power of each PDI input over time. As an independent variable is successful in predicting the movement of a dependent variable like corn, the predictive value of such a variable is given quantitative credit for such helpful reports. As predictions are verified to produce trading profits, the importance of such variables is correspondingly reinforced. Conversely, when predictions dont pan out, variable importance correspondingly reduced. PDI learns from experience as more and more information is provided. Whether your historical access is ten years or 50, you should have a large proportion of the information needed to get a good prediction of todays directional movement. Each day examined provides an opportunity to positively or negatively reinforce the predictive nature of each causative variable introduced. As with many sequential analysis techniques, the more facts and data provided, the better.
Even though the work is still a few months away from completion, we are finding many more ways in which this new PDI product can be formulated. Here are a few examples:
The price of corn in the future is somewhat influenced by what many commodity traders identify as the basis. The basis is the difference between the price of cash corn and the price of corn futures. When the price of cash corn exceeds the price of a given forward corn delivery month, there is a historical tendency for the two to converge. Quite often, the futures product will increase to approach the cash crop. This being the case, the basis could influence the price of corn upon delivery.
****************************************
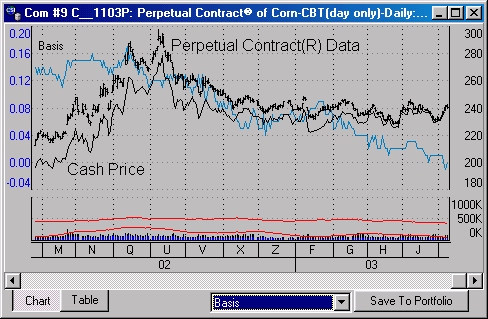
This chart shows Perpetual Contract Data for corn (the bar chart) along with the corn cash price and the basis, which is the spread between the two. The cash price is below the Perpetual Contract price in the earlier data (at left). As the Futures prices and cash prices grow closer, the basis value drops to near zero (see scale on left). The basis dips below zero as the cash value rises above the Perpetual Contract data value in recent trading.
This is an example of a relationship PDI might consider and seamlessly apply to analysis.
*****************************************
Similarly, the directional movement of a corn futures contract may be influenced by the intensity of day-to-day movement (volatility) in corn price and the day-to-day fluctuations in corns trading volume. PDI examines situations and determines the degree to which price affects price, volatility affects price and volume affects price in the market studied.
Likewise, the day-to-day fluctuation of the put/call ratio of corn options has a sizeable effect on the movement of corn price over a similar period. This might lead to a conclusion that, under certain circumstances, the price of one factor might very well predict the price of another. All of these recent facts are affected by and are reflections of investor sentiment. PDI's careful evaluation of each of many inputs can help the program determine which independent factors might lead to quality predictions.
Other factors that PDI can take into consideration are the host of outside influences on the specific market to be predicted. For example, the price of fuel, which affects production costs, and the price of wheat (a substitutable commodity) can impact the price of corn. PDI can run cross-market studies to determine the effects of appropriate markets on the market to be predicted, and determine which have promising predictive powers.
PDI can look at data in the CSI database to check on the influence of large commercial trader interests in the commodity of your choice. It could use government reports on Commitments of Traders, or rely on Steve Briese's COT indexes derived from USDA data for this purpose. Both types of data are available from CSI and one or both could serve as PDI input, depending upon the nature of the predictive relationship.
There may be many such relationships that are helpful in predicting the price of commodities. In the final analysis after thousands of days of study, PDI will have made excellent incremental use of the independent variables with the most predictive properties. Only through a massive database repository such as that made available from Unfair Advantage can such heuristic choices be made.
It is our intention to make PDI into a learning machine which, through evaluations of market performance based on the data provided, may actually learn from the markets over time. It will do so without re-examining the decision-making process or forcing inappropriate hindsight judgments.
The forthcoming version of PDI is designed to choose from up to 15 or so important relationships that involve the future price of a particular commodity. Using corn as an example, PDI would use a mathematical approach that will monitor the movement of corn with respect to independent inputs that relate to corn. Trading signals are generated and tracked over time with the intent of profiting from the significance of suggested positions in corn. The results will show equity growth (or loss) in your corn account over time. A unique filtering procedure will express the predicted level of on-going profits in your account.
As you have probably inferred, the quality of input data is extremely important in PDI evaluations. This is so not just for external markets, but for the underlying commodity to be studied as well. As PDI uses extensive historical data, continuous series must be used, and the formulation of these series is critical to analytical success.
Many traders regularly use Unfair Advantage's ability to construct an extensive historical series of back-adjusted commodity prices, built by splicing one contract with another and adjusting for price discrepancies over time. These may be fine for some types of analysis, but they are not useful for comparing to cash prices in developing basis data. The reason: back-adjusted prices can easily move into negative territory deeply into the past - a phenomenon that will never be reflected in cash series. Only a CSI Perpetual Contract® data series can be realistically compared to actual cash prices because the time-weighted averaging approach of a Perpetual Contract data doesnt lose sight of the actual value of the underlying commodity.
A powerful API was written to develop this system of trading. The API ties the PDI software to the full data and helpful study repository of Unfair Advantage which tracks the full historical coverage of many thousands of stocks and fundamentals and historical data reports on every world futures exchange. The user simply selects a dependent market series to be predicted and the related markets and variables that are suspected to directly influence the future price of the chosen commodity. Typically, the more history given to the prediction process, the better will be the result, and the greater the profit. The systematic approach will monitor results day-by-day, and report on the results achieved. Although stocks, and futures are the initial focus of analysis, other markets, such as options and Single-Stock Futures, may provide fruitful and abundant opportunities.
Our vision is to provide a trading system for investors that will eliminate some of the risks associated with trading the markets. We are still undecided about how to market PDI, but will likely make a free trial available to Unfair Advantage subscribers. A fully functioning version will be available by separate purchase, perhaps from a third-party vendor. We strive to find ways to make trading a more stable, reliable source of income, as opposed to the buy-and-regret exercise that so many investors have suffered through over the past couple of years.
PDI will also incorporate a safety net that uses a Kalman Filter to set stops, should inadvertent losses materialize. Nevertheless, it must be said that, no matter what our ultimate success may be, the markets are inherently risky, and not suitable to all investors. Past performance is never a guarantee of future performance. We firmly believe that market predictions, when based on facts, information and sound mathematical principles, stand a good chance of producing profitable results.
Bob Pelletier
Who Owns Perpetual Contract(R) Data?
Perpetual Contract is a registered service mark of CSI. The concept was invented by CSI in the very early 1970s, and the mark is exclusively owned by CSI. It is our intellectual property, bought and paid for. This doesnt stop data or analysis companies from using the term, claiming credit for the mark, and using it without giving credit to CSI.
A few authors and data firms have represented that the Perpetual Contract® service mark has somehow fallen into the public domain, and that they have a right to use our mark without our consent. Apparently, they think their use of our mark will make it so. When you see someone committing such an act, consider the character of the company who has knowingly commandeered our intellectual property rights, and question whether you want to do business with such an organization.
Tech Talk
Each month in this column, the CSI technical support staff addresses issues that may be of interest to many subscribers through this question-and-answer forum. This month they discuss detrending stocks, Unfair Advantage's "Send to Third Party Software" feature, and several aspects of UA's portfolios, including resetting columns, sharing a portfolio and pasting a stock list.
Q. Some of the stocks I chart from my Unfair Advantage portfolio display with a "d" appended to the stock symbol, as "IBMd" for IBM. What does this mean?
A. The "d" stands for "detrended." Detrending is a manipulation that attempts to remove distortions in long-term data series that often result from inflation. Current values reflect current pricing, but historical prices may be adjusted. Charts are detrended only if you specify the "detrend" setting while adding the issue to your portfolio or while creating the chart.
Q. Under what circumstances would I want to use UA's "Send to Third Party Software" feature?
A. As the name implies, this feature writes export-format files in your choice of ASCII, CSI (QuickTrieve), MetaStock, CSIM formats. These exported files could be used with any compatible program, usually provided by a third-party software firm. When you use this feature, you define the list of stocks, futures or options to be written to files, and include all necessary specifications to customize the data series. In addition to creating the export files you specify, this feature also saves the list in the selected portfolio for future use.
Q. I fiddled around with the size of the column headings in Unfair Advantage's Portfolio Manager panel, and am having trouble getting them back the way they were. Can anything be done about that?
A. Yes. Click the Portfolio menu at the top of the UA screen and then choose, "Reset Column Widths and Placement." The screen will return to its original layout.
Q. I spent some time setting up a portfolio of back-adjusted futures contracts with individualized roll-over specifications, accumulation methods, etc. Is there any way to give a copy of that portfolio to an associate?
A. There is if your associate also uses UA. Here's how: Send an e-mail with a copy of your ua\archives\portfile.adm file as an attachment. When the e-mail is received, the attachment should be saved anywhere EXCEPT in your associate's own ua\archive folder. He or she can then use the "Import Portfolio" feature on UA's Portfolio menu to locate and import your portfile.adm file. (It's a UA portfolio). Your associate's existing portfolios will remain intact and yours will be added to UA's portfolio list. A word of caution - if you and your associate have portfolios with the same names, they will be merged. Your associate will have the choice of retaining or replacing each redundant item within those merged portfolios.
Q. Every month I download a report containing "stocks to watch" in a Microsoft Word file and then I manually enter the symbols into an Unfair Advantage portfolio. Is there an easier way?
A. If it's a long list, we might have a time saver for you. First convert the list to a table using Word's Table menu. This will allow you to isolate the symbols as a separate field. If the symbols are embedded amidst other text, try separating them with tabs on either side before converting. Once you've got a column of symbols, copy the column (select it and then press <Ctrl> c) and paste them (<Ctrl> v) into a new document. Use Word's Table menu again to convert the table back to text. Use the Replace function (on the Edit menu) to replace all paragraph marks with commas. This should create a line of text that includes only stock symbols separated by commas. Select all the text with your cursor and copy it to the clipboard (<Ctrl> c).
Launch your Unfair Advantage and create a new portfolio as usual. When the time comes to add symbols, first make sure that the market type is set for stocks. Next, instead of typing symbols, click once in the symbols box and then paste the list (<Ctrl> v). Voila! The list will be pasted into the symbols box. Check to make sure the stock specifications are as desired (detrend, export formats, etc) and then click [OK].
If all goes will, the portfolio will be created and built immediately. If any of your symbols are not recognized by UA, they will display individually and you'll be asked if each one is a commodity. In this case, click [OK] and then scroll to the offending symbol and delete it. This procedure isn't practical for a short stock list, but you might find it handy.
Q. How can I display two UA charts on the screen at once?
A. Make both charts by either selecting them for charting from your portfolio or by using the "New Chart" icon. They'll probably display "cascaded," which means one opaquely overlaying the other, with just the header of the back chart showing. To see both charts at once, click the Window menu and then select "Tile." Both charts will display, one stacked above the other, filling the screen.
Another way to see two time series at once is to copy the price data from one chart to another, so that both are included in the same chart. To do this, display both charts at once (either by tiling them or by adjusting cascaded charts) and then click your mouse on the bar chart you wish to copy. Holding the mouse button down, "drag" the bar chart into the destination chart. "Drop" the bar chart into the new window by releasing the mouse button. Each time series will have its own color-coded price scale.
800-274-4727 | 561-392-8663 | 561-392-1379 (Fax)