

[Click here to return to journal index]
© Copyright 2003-2004 by Commodity Systems Inc. (CSI). All rights are reserved.
Website Links: This CSI website and Unfair Advantage system contain hyperlinks and automatic links to websites operated by parties other than CSI. No association with or endorsement of third-party websites should be inferred through these links. They are provided for your convenience and reference only. CSI is not responsible for and has no control over the content of third-party websites.
The CSI Team - At your service:
Andy, Betty, Bob, Debbie, Denise, Fran, Heather, Jason, Jeanean, Jose, Josh, Kathy, Ken, Kurt, Linda, Mike, Nassrin, Patti, Ron, Rosie, Rudi, Sabrina, Sean, Steven and Terry.
|
January 2005
CSI Technical Journal Volume XXIII, Number 1 |
Page 1 |
Topics discussed in this month's journal:
Learn To Earn With Unfair Advantage
I am still learning. The Renaissance master Michelangelo is said to have favored and often repeated this phrase. Its simplicity spoke volumes about his humility and his brilliance. To be learning is to acknowledge that one does not already know it all. To be learning is to grow intellectually. It is to go through life with eyes wide open and to enthusiastically seek new discoveries.
The New Year marks a good time to ask ourselves if we, too, are still learning. Learning requires leaving the familiar and moving into the unfamiliar. It requires setting our egos aside. Learning is not always easy, but it is necessary for progress. The Chinese have a saying that aptly describes this aspect of the human condition. It goes, Learning is like rowing upstream - to not advance is to drop back.
That exhausted, frustrating feeling of always fighting the current, yet falling farther and farther behind comes not from failure itself, but from failure to learn. I am fortunate to work in an office full of bright young people who are continually introducing new ideas. We are all fortunate to work for clients (you) who are constantly challenging us to come up with innovative solutions. I think we are still learning here at CSI. At the very least, we are still trying to learn. With this newsletter, I invite you to learn more about the tools we have created to help you achieve a better understanding of the markets.
It has become a bit of a CSI tradition to make a New Years introduction of our products that are new, improved or just undiscovered treasures. These include database components, website offerings and, of course, features of our Unfair Advantage (UA) software. I hope you will find this information helpful and that what you learn here will help you achieve financial success in the days ahead.
Probably the most undeservedly overlooked Unfair Advantage software feature is the programs impressive cadre of technical indicators. The menu of Interpreted studies quietly grows on a regular basis and now includes more than 30 selections. Among these youll find many examples of oscillators, volatility studies and the like, as well as some unique indicators developed right here at CSI.
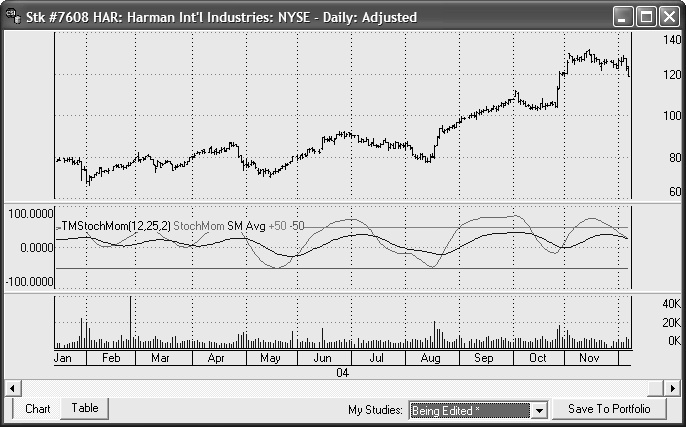
One of the many non-proprietary technical indicators included on the Unfair Advantage Interpreted Studies menu. Each of these studies can be adapted and edited by the user.
Unfair Advantage includes an editor that lets you write trading algorithms or modify those provided. It supports Visual Basic, Perl or our own evolving AnyLanguage, which also interprets code you may have written for other popular platforms such as found in S&C Magazines monthly Traders Tips. This is truly a boon to programmers. Weve provided all sorts of helper routines to get data and perform basic computations, and we provide the programming to chart and test your program. The sample programs are fully disclosed and can be used as models for developing your own analysis routines.
One of my favorite Unfair Advantage studies is the comprehensive Seasonal Index, found on the standard (not interpreted) study menu. Seasonal Indices are compilations of daily seasonal values for individual commodities that show you where you can expect a seasonal market to be heading. Unfair Advantage calculates a seasonal index rating for each of the average 251 trading days per year for any commodity based upon seasonal behavior for the given market over the cumulative past. Beginning with the first day of the second year of historical information, each additional day of recorded history refines the overall expected seasonal waveform. When the last year of fine-tuned readings is processed, a forward-looking projection appears for the forthcoming year.
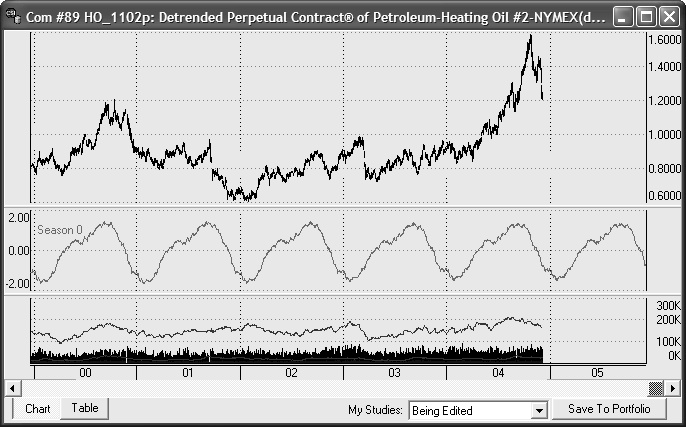
Unfair Advantages Seasonal Index study applied to Perpetual Contract® Data for Heating Oil. Note the forward-looking projection at the right edge of the chart.
The Heating Oil market has a very pronounced seasonal cycle that has been observable since trading began in 1978. All 26 years were included in the application shown here, although the full period is not displayed. If you look closely, you may observe a slight change in the seasonal pattern during the final five years shown. A seasonal trader using this index should have done well by moving in concert with the expected emerging wave form of this very seasonal market. If your UA database is limited to less than 25 years, you may not see such a striking seasonal waveform.
When evaluating the validity of UA's projected seasonal index for any market, visually verify the projected seasonally with the raw data supplied. In analytical efforts, one must empirically weight the value of all indicators, including the seasonal component. No analytical approach, used alone or in combination, can eliminate the substantial risk associated with futures trading.
This computational approach employs a proprietary statistical algorithm that measures the likelihood in standard deviation units that the current market will rise or fall in the near term future. Inherent seasonal tendencies make it likely that an annual pattern will emerge and repeat. Therefore, as each successive day of historical information is observed, the forward waveform is revised and refined ever so slightly. For this reason the derived seasonal waveform on March 15th, 1965 will reflect the historical pattern on all data inclusive of that date; the waveform provided March 16th, 1965 will add one additional day of data to paint the future seasonal picture. The index itself represents a + or - 3 sigma confidence interval over time. It reflects and reports upon the entire history of the series given as input in a cumulative manner.
Two features of the Seasonal Index algorithm make it unique among seasonal studies. First, it is a daily study, not based on monthly averages as some seasonal studies are. Second, it is what I like to call forward-looking. We dont use curve-fitting or other manipulations to adjust the waveform so that it conforms to the past. This indicator learns from the past to predict the future, so the more extensive the history it has to study, the more valid will be the current indicator. The form and design of the index let the trader look forward any number of trading days from 1 to 251 (the average number of trading days in a typical year) to gain a perspective for the future. In our view, there is no better way to forecast the seasonal element.
To add Seasonal Index data as a study to any continuous price series, simply make a daily chart of the underlying market and click the "Change Indicator on Chart" button on the toolbar. Next click [Add Study] and then choose "Seasonal Index" from the drop-down menu. Select it from the toolbar and then choose [Apply].
This study is best suited to highly seasonal crops such as barley and wheat, but it may also be useful for industrial seasonals such as heating oil. All markets can be analyzed in this manner, but markets which absolutely do not exhibit seasonal behavior should be analyzed with other more appropriate tools. See the UA online manual for more information about the Seasonal Index, including its Amplify option, and the advantages of detrending data before analysis.
MarketScanner is another Unfair Advantage feature that has changed and has become even more functional in the past year. Probably the best thing about that product is that it allows you to scan and screen markets using individual studies and/or market facts such as the fundamental and econometric data found within UA.
UAs MarketScanner can accommodate all 50,000+ stocks in the UA database as a starting inventory, but you may target any particular exchange. (Competitors of CSI limit their inventories to perhaps a total of only 7,000 stocks.) Heres an example that starts with a database of just AMEX stocks: (Step 1 - identify exchange through the options menu). Next include just those stocks with positive earnings per share (step 2 - add stock-specific earnings column and step 3 - filter by greater-than zero). Now say we want to narrow this down to stocks with a Price/Earnings ratio below 20 (step 4 - add stock-specific Price/Earnings Ratio column and step 5 - filter by less-than 20). To fit my budget, I keep only those priced at $15 per share or less (step 6 - add indicator (last close) and step 7 - filter by the close column at less-than or equal-to 15). Today this seven-step exercise returned a list of about 80 stocks. I know because MarketScanner counted them when I asked it to Form rank from the CSI number through the Columns menu (step 8).
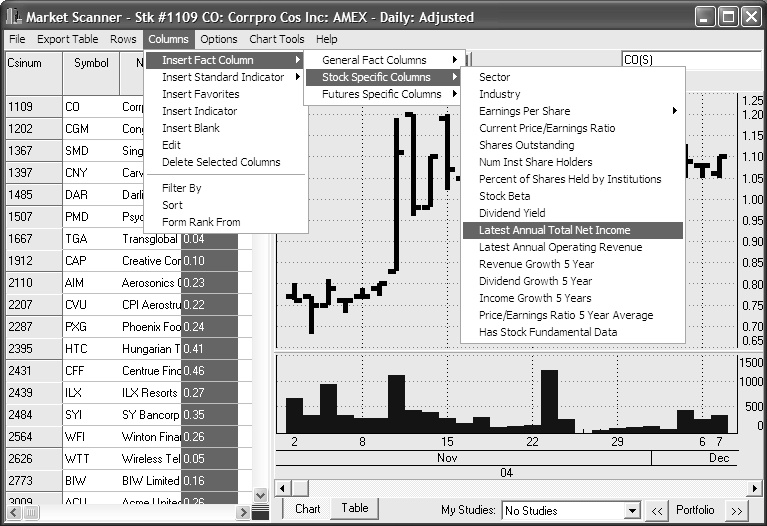
This MarketScanner screen shows a few of the menu features and stock-specific facts available for scanning and screening. General facts, futures-specific facts and technical indicators can also be used.
To further discriminate, say we narrow our list down to just Technology stocks (add stock specific Sector column and then sort by that column). Dragging the mouse, we highlight the group of Technology stocks on the list and then, using the Rows menu, delete all but selected rows. This leaves us with about a dozen stocks to choose from. We can easily scroll through charts of these stocks, and add any or all to a UA portfolio as desired.
This was an arbitrary set of facts used for a sample scanning and screening. Im sure you can imagine using it with indicators and studies that are meaningful to you. MarketScanner can do similar exercises using your own preferences for the steps shown, leaving you with a small list of markets for trading or further testing.
Keep in mind that any of the studies in UA, even custom programming, can be inserted as a MarketScanner column and then used for scanning and screening. One study that traders find very helpful is our Emerging Market study that has been reported upon in earlier CSI Technical Journals (12/2000, 5/2002). If you have a study that you enjoy processing, please let us know and we will try to add it to our extensive inventory. A quasi limitation you should remember is that MarketScanner typically loads a rather short history for each market (25 days) so that the active database will be manageable. It isnt appropriate for long-term analysis of many markets simultaneously.
CSI customers can also benefit from screening exercises done by our host computer and displayed on the CSI website. You may freely consult the many interrelated correlation studies available by visiting our website and entering your UA User ID and customer number. The correlation studies show you the long-term relationships between markets that can be very useful in timing your trades. If you are interested in trading Live Cattle, for example, it could be very helpful to examine the movement of markets that are heavily correlated with Live Cattle. We have reported on this on earlier occasions. Any Live Cattle trader should also watch the Canadian dollar. It appears to be negatively correlated with Live Cattle from a statistical perspective. See for yourself the tendency of Live Cattle to rise in price when the Canadian dollar falls in relation to the U.S. dollar.
A CSI website correlation study showing the relationship between Live Cattle and Feed Wheat.
The chart above illustrates the negative correlation between Live Cattle and Feed Wheat, which oppose each other in price. Similar illustrations are repeated thousands of times within the CSI website offerings of highly correlated markets, showing both positive and negative correlations. Many opportunities are uncovered daily through that medium. For every trading opportunity one might consider, there is often a corollary that deserves investigation before launching that important trade. CSI's correlation studies should be consulted before making any investment to minimize risk of your capital.
Similarly, when Live Cattle rises in price, expect Feeder Cattle to rise also. One or the other may exhibit leadership in this relationship. Feed wheat (symbol WW) is another market that is negatively correlated with Live Cattle. These are just a few examples of avenues which one could explore using the vast resources of CSIs website information base.
CSIs expanding capabilities are not limited to end-user programming features. Our Data Department staff relentlessly seeks to add new markets and fundamentals to the database and to hone our internal reporting methods. Unfair Advantage includes a database that stretches beyond any competitors, not just in its broad scope of markets and fundamental data, but also in the depth of historical coverage. The list of available market types itself is staggering. In addition to the rather pedestrian domestic futures, stocks and funds, and more exotic world markets, you may be surprised to see interest rates, economic statistics, general cash series, Commitments of Traders, Foreign Exchange Rates and others.
Theres a considerable list of new stocks and futures in this newsletter, just as there is every month. These are automatically added to your UA factsheets and are available for updates immediately. Stock statistics listed on the factsheets include valuable corporate action information such as shares outstanding, dividends, annual net income and much more. Futures statistics include average total volume, trading currency, contract size, units, etc.
Our monthly newsletters also include Error Reports. These are short by any standards; incomprehensibly short when you consider the massive data delivery task we undertake each day. The fact that error reports exist at all shows the care we put into quoting statistics correctly the first time. You might say these error reports represent the crack beneath the door, revealing just a glimmer of the light we shine on CSI data to assure accuracy.
Theres more, of course. You already know that Unfair Advantage gives you charting and technical indicators along with tools for custom programming, but did you know it also includes a Position Manager module for tracking your positions in 20-minute delayed time, P&L and account equity? Have you tried the truly remarkable Trading System Performance Evaluator (TSPE), which lets you test the integrity of your trading system before risking capital? Have you tested SnapQuotes for quick intraday updates?
Do you require cash price data on the universal set of markets we follow? CSI stands alone with a full set of daily cash prices on nearly all 80+ world futures markets also cover world index markets many world stocks stretching years into the past.
Whats ahead? Our latest brainstorming sessions have focused on ways we can easily accommodate customers who have previously used other data vendors, and customers who use trading programs that arent compatible with CSI. A common grievance of investors is that they would like to use CSIs quality data, but are tied to another company to achieve compatibility with a particular analysis program. This frustrates everyone involved, so it is a problem we have solved or are in the process of solving. Whether traders come to us seeking data longevity, accuracy, reliability of service or simply our broad market mix, we hope to meet their needs through improved compatibility and performance.
Our plan is for investors using other data service such as Prophet, Dial Data, Genesis, etc. to be able to experience the higher quality of CSI data and the resources of Unfair Advantage without changing downloading software. As you may know from an independent test sponsored by Futures Magazine, CSIs data error rate was a very small fraction of the error rate of every other firm examined, including all of the above. Our error rate was shown to be less than nine percent that of Dial Datas error rate. CSI customers experience an improved level of service at comparable or lower prices with vastly improved accuracy and data availability.
Aristotle wrote that we learn by doing, so I heartily recommend a thorough hands-on exploration of Unfair Advantage. I think youll enjoy the process. If this New Years message inspires any learning experience with CSI data services or our Unfair Advantage software, I hope the path leads farther than the few small parts of the whole presented here. Most especially, all of us at CSI hope that a more complete understanding of our services will help you prosper in the New Year.

Bob Pelletier
Tech Talk
Each month in this column the CSI Technical Support Staff addresses issues of interest to many CSI subscribers. This month they discuss creating Nearest Futures charts with Unfair Advantage, using the Snapshot and Position Manager to view a summary of prices, and accessing SnapQuotes.
Q. I am trying to create a continuous chart from a series of futures and simply cannot get the hang of the instructions in your help files. I just want to tack one series onto the end of the next with the determining factor being volume traded. How do I do this?
A. Thanks for calling to our attention that this section of the online manual is outdated. It is being corrected now and the upgrade should be available by the time this article appears in the Technical Journal. It might also be helpful if you knew our name for the series you are describing. We call these Nth Nearest futures because you can decide if you want to string together the contracts that are Nth (first, second, third, etc.) nearest from expiration. The selection screen also allows you to choose the roll-forward date, which can be any given date within various calendar months relative to delivery, or volume (your choice) or open interest.
To create such a chart, click the "New Chart, Full" icon on the UA toolbar (third from left). The UA selection screen displays as shown in the example (top). Select your desired "Market Type" (in this case, Futures) and then type the symbols for the individual commodities you want to chart into the Symbols box. If multiple commodities are to be handled in exactly the same way, you may list them together here, separated by commas or spaces. For example, for corn and wheat, you would enter C, W into the Symbols box.
You will then have the opportunity to specify your preference for several additional settings on the Market Selection screen. These include: Contract Months to Include (not applicable for multiple markets), Date Range and Post-Processing options. Traders usually take the default selections for these. The most critical selection on this screen for you is the contract selection itself. Click the Nth Nearest tab to display all the user-defined features for this type of series.
For your purposes, Roll Trigger = Volume, Roll Timing = your preference - probably Aligned to pricing, and How Many Contracts Out = 1, Nearest. When all of the above settings have been selected to your satisfaction, click [OK] to create the chart. An example is shown (lower graphic).
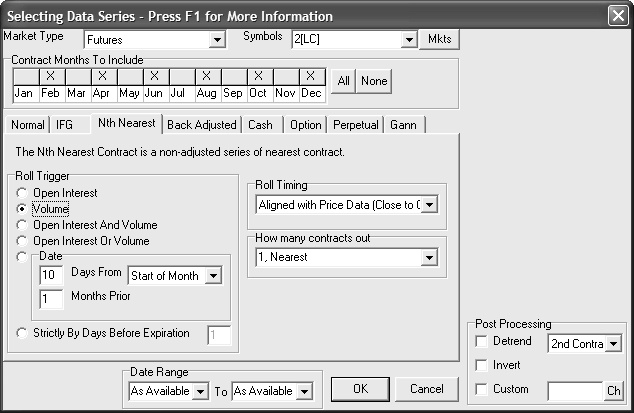
The selection screen for adding a first-nearest futures contract.
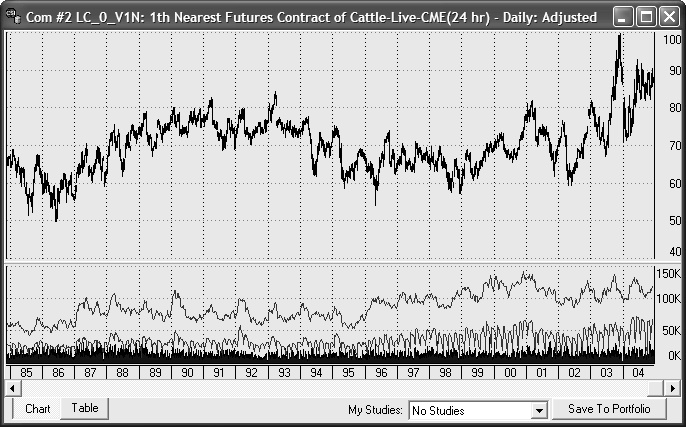
The 20-year first-nearest future series produced through the above prompts.
Q. Does Unfair Advantage let me display a newspaper-style list of todays prices for my various holdings?
A. Yes. You can view this in either of two ways. The choice that most closely resembles a newspaper is UAs Snapshot feature. Click the camera icon from the toolbar or click the Database menu and then choose Snapshot. The selection screen gives you the option of viewing everything in your portfolios, a single commodity, everything in one portfolio or all commodities. Make your choice and click [Build] to view the listing.
You can also view your holdings or a watch list in the Position Manager spreadsheet environment. To get there, click Unfair Advantages Trading Tools menu and then choose Position Manager. Use the Positions menu to add an entry for each market you want to view. Type entry prices and position sizes if desired. Use the Settings menu to specify if you want Position Manager to display intraday quotes from third-party websites or the latest daily update from CSI.
Q. Im clicking the SnapQuote (SQ) icon on the UA toolbar, but nothing is happening. Why cant I pick up intraday quotes?
A. For anyone who doesnt know, SnapQuotes are recent, intraday prices collected from third-party websites that you can view as the last bar on your UA charts. That last price bar displays in a different color, so youll know that it is not an end-of-day verified quote from CSI. If SnapQuotes arent working for you, try these troubleshooting ideas:
1) SnapQuotes require an Internet connection. Is your computer online with access to the Internet? Test it with another program and get online if necessary.
2) Did you activate Intraday Quotes in the portfolio listing for the desired markets? This is best done by fully expanding the Portfolio Panel. (Click the small right arrow on the panel border.) Note the last column, Intraday Quotes. Only those markets that show a check mark in this column will update when SnapQuotes are activated. As you probably inferred by now, only items in your portfolio can be affected by SnapQuotes, so add your choices there. If you still have problems, please contact CSI Technical Support.
| Marketing: | 800-274-4727 or 561-392-8663 weekdays between 9am and 6pm Eastern time. |
| Tech Support: | (561) 392-8663 weekdays between 8:30am and 9:30pm Eastern time. |
| Billing: | (561) 392-8663 weekdays between 9am and 5pm Eastern time. |
| Fax: | 561-392-7761 |
800-274-4727 | 561-392-8663 | 561-392-1379 (Fax)