
[Click here to return to journal index]
March 2005
CSI Technical Journal
Volume XXIII, Number 3
Focusing on Economics - Combining Econometric Resources with UA Market Data for Long-Term Trading Success
Macroeconomics - n: the branch of economics that studies the overall working of a national economy.1 Theres no doubt about it; macroeconomics is a very broad topic. It is one that most traders dont attempt to tackle as part of their investment strategy because its so, well, large. I submit to you that you have the ability -- and the resources at hand within Unfair Advantage -- to include at least some modicum of macroeconomics in your investors toolbox. Your trading success will likely improve for your efforts.
Regardless of how carefully you study price, volume and your technical indicators of choice, if youre not also keeping tabs on economic data, youre only seeing part of the picture. Individual price series give you a close-up view of whats happening in your investments; broader indexes reveal more about the business climate, but economic data (the input data for macroeconomic study) provides the background view, offering what some consider a more visionary approach to investing. Although you may have overlooked some factors, within the CSI database provided through Unfair Advantage are economic, government and fundamental data that will give you a broader, clearer look at what may lie ahead.
Before going further, a caveat: economic analysis takes some time and effort. In order to benefit from the economic data we supply, you must first learn which indicators are meaningful to you and learn how to interpret those indicators. That doesnt mean you need a Ph.D. or years of study. As R. Mark Rogers, noted author and 19-year veteran of the Federal Reserve Bank advises on his website, economic analysis has several layers of complexity. He asserts that beginners can join intermediate and advanced economy watchers in gaining something from the study of economic statistics -- at whatever level of study they choose to embrace. His website (www.economic-indicators.com) holds a good deal of information and a wealth of links to informative articles that can lead you to a growing understanding of the economic factors affecting your investments. It is highly recommended!
Is Economic Analysis Just For Economists?
Popular business magazines support the idea that an understanding of economics is useful to everyone in business, which naturally includes all investors. For example, Business Week magazine invariably offers no less than two articles about economic news and views, one with the auspicious title, Business Outlook. Senior Editor James C. Cooper and Kathleen Madigan co-author this column, which brims with statistics on Gross Domestic Product (CSI #2815), imports (CSI # 2719), exports (CSI # 2720), Fed Funds rates (CSI #2133), retail sales (CSI #3201), etc. A recent column cites business equipment sales (CSI #2832) as an indicator that the U.S. is still driving world economic growth.
New York Times business writer Daniel Akst frequently quotes many of the economic series that are available to you through the Unfair Advantage economic database. His recent column (On the Contrary, NYT 2/6) forecasts rising inflation based on a rising Consumer Price Index (CSI #2710) and the yield spread between 10-year treasuries (CSI #3719) and inflation adjusted treasuries (CSI #3724) - see chart. He also references increasing prices for homes and Gold (CSI #30). He points to the dramatically increasing steel prices (CSI #2771) as evidence that many products will be more expensive in the coming year. More on that later.
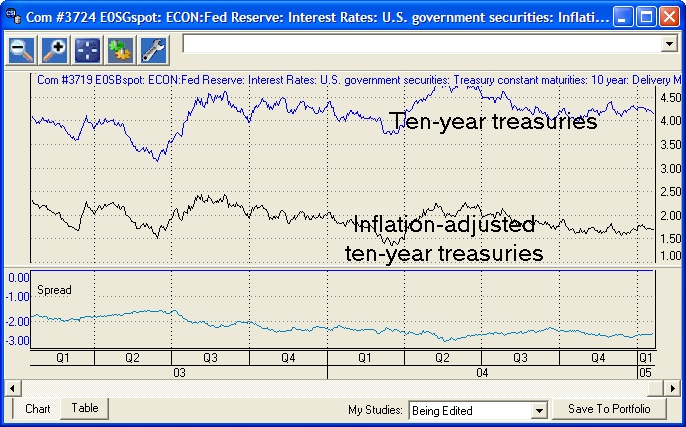
Does the spread between ten-year treasury issues and inflation-adjusted treasuries predict rising inflation?
Im a regular reader of Active Trader Magazine, an excellent magazine that includes not only a monthly column on the economy, but many how-to trading articles by Peter Navarro, Ph.D., a Harvard-trained economist. He frequently discusses macroeconomics and cites statistics on various economic indicators in explaining market movement. These respected analysts arent tossing economic statistics around to impress, but to educate readers about the impacts and predictive tendencies of these important figures. Its almost enough to make you wonder how you can succeed in investing if you dont track economic data. But its also enough to make you wonder how youll ever make sense of it all. Remember that you dont have to; even beginners can benefit from some economic analysis.
What can economic data do for you?
I am not an economist, but it doesnt take much effort or training to see economic links. Lets have a look at some economic series and relationships you can view through Unfair Advantage. As mentioned earlier, whatever your CSI subscription category, economic data series (historically and current) are available to you. To create a chart or portfolio entry of economic data, begin as if you were selecting a standard stock or futures market, but instead of entering a symbol in the Symbols box, click the [Mkts] button to view a list of all market types. Scroll through the menu and select Economic Statistics. An extensive list displays, similar to the example below. (Additional economic data can be found in the Cash/Forward/Fundamental category.)
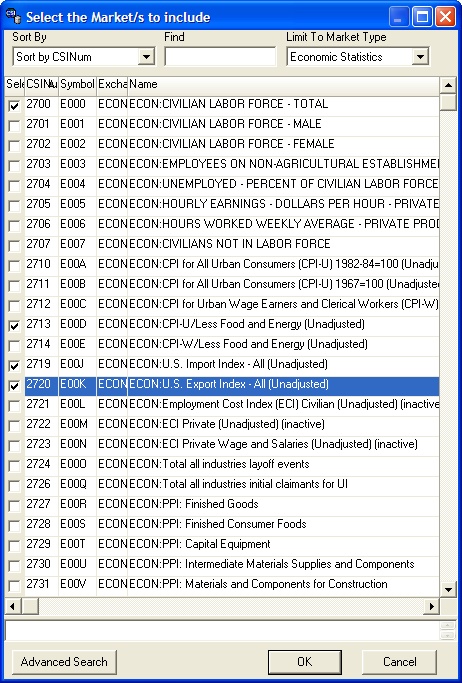
The main categories of government data are: Productivity reports; Producer Price Indexes; Interest rates from the Federal Reserve; Commercial Paper; Personal data such as savings, earnings, debt, disposable income; Industrial Production; Labor statistics and more. Check the boxes for any series you may wish to view.
Since Im basically a techno-fundamentalist who prefers traditional commodity markets that are supported by both technical and fundamental inputs, this first example focuses on data series that seem to hold key economic components -- energy and food. I started with CSI #2727, which is Finished Goods and added CSI #2734, which is Finished Goods less the costs of food and energy products. See below for the chart. It tells me that overall inflation is steadily going up, but if energy costs are taken out of the equation, the cost of living is actually close to being flat. Thats an interesting piece of information that might help in making investment decisions.
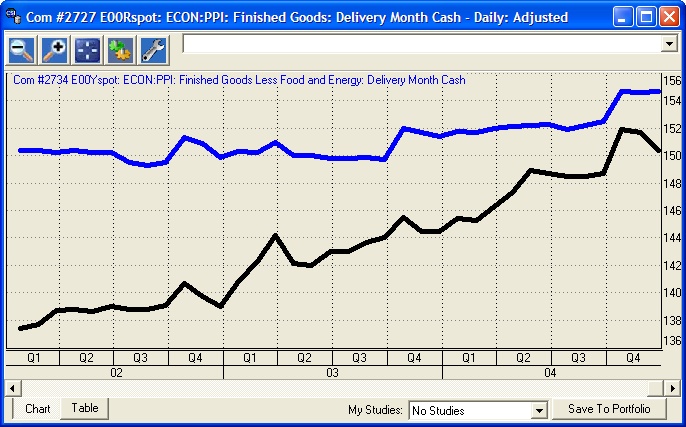
Producer Price Index of Finished Goods (top) and Finished Goods without spiraling energy and food costs (lower curve). Note the recent drop.
Several of the economic statistics are available with and without food and/or energy costs included. These are valuable in that they give the chartist a feel for which component(s) are important for the given index as a whole. In some cases, when a key component like energy costs (oil and petroleum) are removed, inflation appears to go away, and the PPI or the rate of growth for the components of the series takes on a new appearance. Look also for indices that are available with and without seasonal adjustments.
The economic data/price data connection
How does government data lead you to better trading signals? You might be surprised at how the combination can improve your chance of surviving, even thriving in the markets. Many of the economic series can be paired off with trading data to help investors improve trading success and achieve a level of overall market understanding.
Among the industries frequently mentioned as being economically sensitive are housing, automotive, metals and textiles. A look at textile data (below, on dual chart with cotton) shows us that as textile production, while abundant around the world, has plummeted in the U.S. for over seven years. The most recent data shows that this may be leveling out. There may be investment possibilities that capitalize on these unfolding economic trends. Cotton traders should take note of cotton prices over this time period.
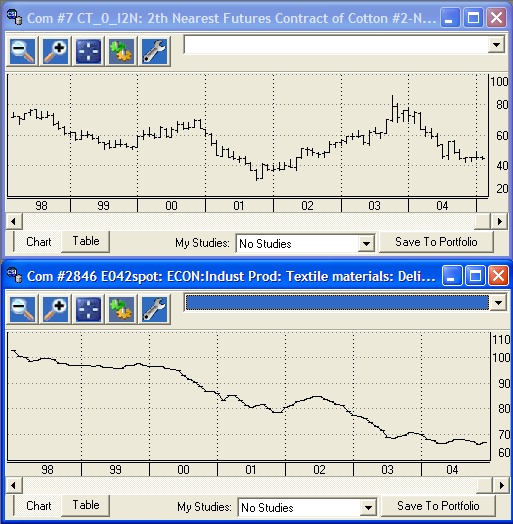
Prices of cotton futures (top chart) have oscillated while U.S. textile production (lower chart) has plummeted over the last seven years. Will the recent leveling of textile production impact cotton prices?
Unfair Advantage has a raft of government statistics that CSI collects from the U.S. Department of Commerce websites. They are typically quoted on a monthly and sometimes quarterly basis. You may find that you prefer to view the historical data for these markets in a quarterly bar frequency which is helpful for achieving a good understanding of longer term market direction.
It only takes one look to see major upward pressure in the price of steel, which is now close to the price of lumber (see graphic, below). Dramatic price fluctuations in both these markets affect the building industry, but have they hurt profits for home builders? Not so much
yet (see Pulte Homes & Lennar chart, below). How this shakes out if steel prices continue to rise remains to be seen.
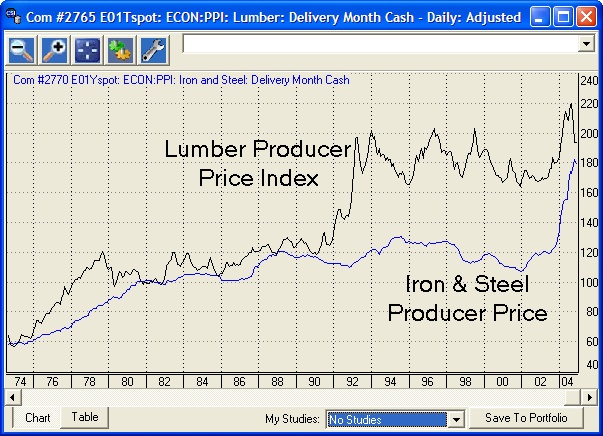
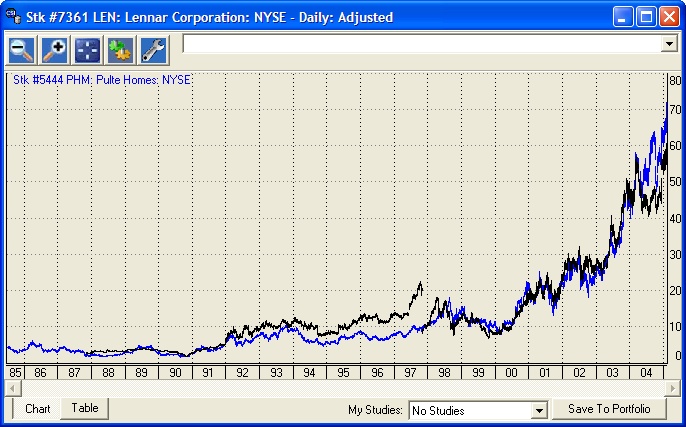
Unfair Advantage's economic database includes indicators such as Producer Price Index data for Lumber and Iron & Steel (upper chart). Analysis of these series allows traders to compare and contrast economic data with related commodities and stocks. Are home builders such as Lennar and Pulte (lower chart) affected by changes in raw material costs?
Foreign Matters
Our extensive set of U.S. economic indicators hints at, but doesnt explicitly report international pressures, specifically those posed by the two fastest growing economies in the world, China and India. A good friend of mine visited China in 2004 and reported that the skyline in Beijing provides stark evidence of the explosive growth in that country. He marveled that massive cranes and construction activities consumed the horizon for 360 degrees, regardless of his vantage point. Another local man traveled to a distant Chinese city and was astonished at the wide highways lined with shiny new factory after shiny new factory. Chinas burgeoning needs can only increase the demand, and thus the price of steel.
In February National Public Radio reported that the U.S. Energy Department predicts world demand for crude oil will increase by 50% over the next 15 years, mostly to accommodate rapid development in India and China. With production stagnant, there is little chance that oil will become more affordable in the foreseeable future. Only when alternative energy products become readily available and when we become better at conserving energy through technology will relief from higher energy costs be possible. Unfair Advantage lets you track the price of crude oil through cash, futures and options data, as well as through multiple indices and economic series. If you arent already doing so, consider using UA to discover and track stocks that are poised to benefit from the the United States inevitable move toward energy conservation and alternative energy sources.
One thing youll want to consider in exploring the UA Economic database is the quantity of these markets included in your portfolio. Unfair Advantage has generous thresholds for the number of markets that may be processed through a portfolio or market scanner, but the massive economic database can easily surpass those thresholds. UA does not in any way restrict which of these markets you may view and analyze, so you should have no problem selectively reviewing government and economic series of interest.
Our website has been upgraded to include economic data in its correlation studies. This allows investors to gain a valuable perspective about economic relationships. The correlation values for interest rate markets like T. Bills or T. Bonds and many different economic series might be useful independent variables for analysis. Visit the CSI website to discover which markets tend to be correlated with the economic indicators.
Economics arent everything.
As Dan Ackman and Mark Hazlin demonstrate in their article, Its Not the Economy Stupid (Forbes Magazine, 8/25/04), economic predictors have their limitations. These writers proposed a set of seven economic indicators that they found to be very predictive in U.S. presidential elections from 1948 through 1972, favoring the winner in six out of seven elections. More recently the same set of indicators favored, among others, Walter Mondale, Al Gore and John Kerry, getting it right in just three of the last eight elections. Times change and so do economic trends. Returning to our theme of the December 04 Technical Journal, it is important to make sure that your economic premise follows a logical flow from cause to effect.
We have shown just a few ways economic data might help you gain an advantage in making trading decisions. I hope that they will encourage you to add these vast resources of economic data to the mix of data you evaluate before your next investment. They are at hand within Unfair Advantage -- at absolutely no extra cost to current subscribers. I think youll be glad that you took the time to broaden your view to include these vital series.

Bob Pelletier
Key interest rate data:
U.S. Gov't Money Supply statistics:
M1 (currency+checking) #3481
M2 (M1+small savings) #3482
M3 (M2+savings accounts) #3483
Prime rate #2140
Discount rate #2141
90-Day T.Bill Rate #2100
1 WordNet (r) 2.0 (August 2003) Princeton University.
Handbook of Key Economic Indicators by R. Mark Rogers
McGraw-Hill, 1998
www.npr.org
Morning Edition, Feb 9, 2004
Analysts See U.S. Goals and Global Oil Needs in Conflict
Tech Talk
Each month in this column the CSI Technical Support staff addresses topics of interest to many CSI subscribers. This month they discuss several aspects about building continuous futures series for long-term analysis with CSI data.
Q. I am a stock trader and would like to begin doing technical analysis on futures markets. The ever-expiring life cycles of the various contracts make this difficult. Is there a way to turn individual contracts into long-term charts for entire commodities?
A. Yes. Unfair Advantage lets you create continuous files for each commodity based on your choice of manipulations. You can build Perpetual Contract® data series, which are time-weighted continuous series that attempt to measure the market at the center of liquidity, or you can create nearest-future series that build long-term charts without any massaging to erase intercontract gaps. Alternately, Unfair Advantage offers Gann series, which concatenate individual delivery months, and back-adjusted series that use various techniques to blend and merge successive contracts.
Q. Im testing a trading system using back-adjusted futures contracts. Will my profit projections be distorted?
A. As their name implies, back-adjusted contracts modify historical prices to create continuous series. This inherently causes distortions. The longer the back-adjustment period, the greater the opportunity for distortion. For example, if you created a back-adjusted series over, say, 50 years for a commodity with, say, five delivery months per year, each of the 250 roll-forwards might require a significant adjustment of perhaps one or two ticks per side in the quoted price. In the corn market, that would likely translate to a quarter-point loss in slippage, plus commission for each of 250 contract roll-forwards. Clearly, the cost could be substantial. The benefit of hindsight bias needs to be considered before accepting projections based on simulated returns. See below for information on roll-forward rules that might reduce distortion by simulating your trading style.
Q. I dont understand the back-adjusted description in the online manual relating to Representative Pricing. Can you please elaborate?
A. Representative Pricing is one of several choices in creating back-adjusted data series. This determines how the gap between successive contracts is handled in an attempt to broadly simulate your buying and selling habits for the given market. (This setting was called delta splicing method in some earlier versions of UA.) Each of the three choices, close to close, open to open, and close to open, involves a calculation of the contract price differential (the delta) that is cumulatively applied to historical pricing.
A close-to-close back adjuster simulates a buy and sell at market on close order, or a spread order executed at close. The delta in this case is the settlement price in the new contract minus the settlement price in the old contract. An open-to-open back adjuster simulates a buy and sell at market on open order, or a spread order executed on the open. The order is assumed to be executed one day later than the close-to-close order since open-high-low-close data isnt available until the next close. The delta in this case is the opening price in new contract minus the opening price in the old contract. The close-to-open back adjuster simulates exiting the current position at the close of one day and entering the new position at the open of the next. The delta is the difference between one day's close in the old contract and the next day's open in the new contract. The overnight close-to-open price differential is generally small, so the close-to-open choice should be highly representative of the contract to contract differential. This method doesnt reflect the typical trading style, however, so it may not be the best choice for your simulation.
Notice:
The views and information expressed in this document reflect the opinions and experience of the author Robert C. Pelletier. Neither CSI nor the author undertake or intend to provide tax advice or trading advice in any market or endorse any outside individual or firm. All recommendations are provided for their informational value only. Readers should consult competent financial advisors or outside counsel before making any software purchase or investment decision. CSI does not stand behind or endorse the products of any outside firms.
Website Links: This CSI website and Unfair Advantage system contain hyperlinks and automatic links to websites operated by parties other than CSI. No association with or endorsement of third-party websites should be inferred through these links. They are provided for your convenience and reference only. CSI is not responsible for and has no control over the content of third-party websites.
All information and data on this website are © Copyright 2002-2005 by Commodity Systems Inc.(CSI) All rights are reserved.
800-274-4727 | 561-392-8663 | 561-392-1379 (Fax)