
[Click here to return to journal index]
June 2005
CSI Technical Journal
Volume XXIII, Number 6
In This Issue
Holiday Schedule
CSI will be closed for voice communication on Monday, July 4th in observance of the U.S. Independence Day holiday. All U.S. exchanges will be closed. Data from other markets will be available at the normal posting times, and the CSI host computer will be accessible as usual throughout the holiday weekend.
Lets Play Ball. Hows Your Lineup?
Im writing from Florida, where we are blessed with baseballs Spring Training. This is the perfect time of year to check out whos playing where, whos hot and whos not. I love a day at the ballpark, but for a little fun out of the sun, I thought Id try some Virtual Baseball. This is an online game where you pick the players on your team (living or dead) and follow the scores as your personal dream team plays out the season. How else can a Marlins fan root for Babe Ruth, my late fathers idol?
I looked into starting a virtual team of my own, but found myself sidelined by a new idea it inspired. Sitting at my computer imagining the perfect starting lineup of baseball players, my mind shifted to the work I normally do there - market analysis. Babe Ruth and Mickey Mantle were nudged out by correlation studies and the Seasonal Index. I found myself mentally designing an ideal set of market indicators and wondered if such a thing could be created. Then I realized that the platform already exists, right here on my own computer. If you own CSIs Unfair Advantage, then you have it too.
In many ways, Unfair Advantage (UA) is like a virtual baseball game for investors. You are the owner and you pick the players, which are, metaphorically speaking, the various technical indicators you employ. You always have home field advantage - its your computer and its your database. Unlike virtual baseball, with UA you have carte blanche to change out the players any time they arent working for you. It doesnt get any better than that, especially when you realize this isnt a game. Its a science-based method for investing your money in ways that can bring real profits.
Maybe the virtual baseball connection is far fetched -- but then again, maybe it isnt. Have you asked yourself lately who is in charge of your trading account? Do you select the markets youll trade, deal with the exchange of your choice and decide which indicators might work best in the current environment? If your system starts failing, do you have a backup in the bullpen waiting to save the day?
Lets face it: no trading system provides maximum profit all the time. The makers of trading software know all about this phenomenon, which is why most offer multiple systems and diverse studies within those trading systems. Do you consider it a chore to decide which to use under which circumstances? I consider it a privilege to choose.
Getting the Stats
What coach would build a dream team without scouring each players stats? Stats are not easy to come by for trading systems -- unless you have Unfair Advantage. The Trading System Performance Evaluator (TSPE) module provides a unique way to automatically evaluate the capital requirements and profit potential of almost any trading system. It works by evaluating both the track record (either real or simulated) and the structure of the trading system. Its a simple process Ill review here:
Before you begin, compile the list of profits and losses for each trade suggested by your system (the P&L record). If your trading system is new, ask the developers for their P&L record so TSPE can prove out their approach before you risk capital in your first trade.
Start TSPE by clicking UAs Trading Tools menu and then clicking Trading System Performance Evaluator. An introduction displays, which you should read and then click [Next].
Although you may import a P&L list into TSPE, for this example well use the manual technique for data input. Click the [Manual] button, and then enter your trades or those supplied by your vendor into the table at the right of the data input screen.

Enter the profit or loss in whole dollars or in points. When entering point values, all entries MUST be based on the same point value. Plus signs (+) are optional, but minus signs (-) are required to indicate losing trades. Press the down arrow to advance through the entry form.
You may enter either your net (after commission) or gross (before commission) P&L values, but be aware which you are using and don't mix both in the same trading record. Enter at least 30 trade results, preferably 50 or more. The selection of samples should be either a census of all trades or a random, representative sample. TSPE calculates the statistics at left automatically. We recommend that you click [Save] and name your trading record so you wont need to enter it again. Click [OK] when your trading record is complete.
The next screen lets you define profits and losses in terms of points. You can find the proper value from within the UA database, if necessary. Enter 1 if your entries represent dollar values. Click [OK] to continue.
The next screen accommodates commission and slippage. Enter them here, or enter zero if you entered net profits and losses.
The final P&L input screen automatically shows the sample size and allows you to enter the number of parameters, which are the restraints that produce trading signals. It also lets you select a correction value. This last input is critical in determining how conservative TSPE will be when adjusting results to compensate for forecasting error.
TSPE produces a chart that shows the simulated Frequency of Profits and Losses after degradation to account for the hindsight performance. After viewing, click [Next] to continue the analysis.
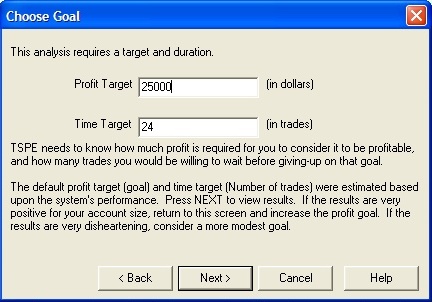
TSPE presents a screen showing the profit target and time target, below. These values represent reasonable expectations from the trading system presented. You might begin TSPE evaluations with these default values and then adjust as needed.
Your computer will now perform a Monte Carlo Simulation. The process iteratively simulates thousands of trades by sampling the trading statistics over and over again as a goal is reached or a bad sequence of events produces a bankrupt outcome. Even the best of trading systems produce unfortunate results some of the time, but TSPEs effort will determine your chances of success. Once the analysis is done, this experiment can be reduced to something that meaningfully explains what you might expect in real life. This is what you came for!
This chart is the result of work I did while building similar models for General Electric. The models were used in proving defense systems for the U.S. military, where system design problems were typically solved in the above manner by simulating operational performance long before the resulting hardware was built. I find that the same techniques can be aptly applied to trading system evaluation.
TSPE helps the trader understand how the proposed system might fare if used in actual trading. Whether you are interested in adopting a method of trading that you may have purchased, one that was proposed by your broker or a market guru, or a method you found on your own, TSPE will evaluate a trading effort and report on the degree to which it might actually succeed. Trading involves risk, and TSPE is programmed to reveal whether such inherent risks are worth the required investment.
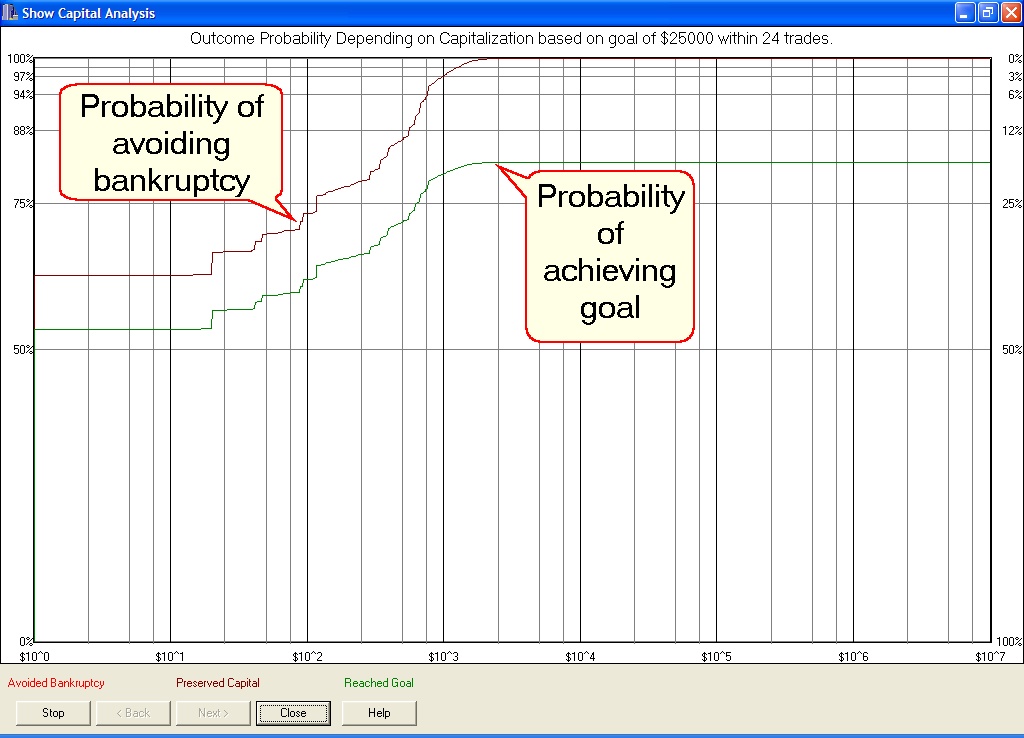
The values across the bottom of the TSPE Capital Analysis chart represent a range of funding levels, in this case, from $10,000 to $10,700. The upper line on the chart represents the probability of avoiding bankruptcy trading the particular system at each funding level shown on the X axis. The lower line shows the probability of reaching the stated goal at each funding level. The sample study shown here would require about $10,350 in funding to have about a 99% probability of avoiding bankruptcy and about the same funding to attain a roughly 80% chance of achieving the goal of $25,000. This analysis could be re-run with different goals to get a good idea of what might be realistically attainable with your available capital.
Make notes on what works at what funding level. These are the statistics that will help you choose which trading system to use in good and bad times or simply assess the merits of the trading system you propose to actually trade. It sure helps to know which systems will bring in the grand slam when you need it most.
Put me in, coach!
While youre analyzing trading systems, dont forget that Unfair Advantage itself is part of your team. Offering a host of analytical studies, it provides much more than just the home field and equipment. Give it a try and youll find that UA is not just here for a cup of coffee.
A good way to jump into market analysis using Unfair Advantage is with its MarketScanner module. This tool runs your choice of technical indicators against a broad range of markets. You can then sort and filter results to skim off the best investment opportunities. If youre already an Unfair Advantage user, theres simply no reason not to consider these free tools supplied by CSI for inclusion in your roster. Why not give it a try?
Launch MarketScanner by selecting it from Unfair Advantages Trading Tools menu. If you havent used MarketScanner before, it will open to the Preferences screen. If this screen doesnt display, click the Preferences menu at the top of your screen.
Next you should choose the Series to Show. Click the arrow at the right of the drop-down menu to display an extensive list of choices and then, for this exercise, choose All in Portfolio. Next choose the portfolio you wish to analyze. If you dont have any UA portfolios, pick another selection method, such as All in Exchange, and then choose the desired exchange. That said, there are real advantages to using a portfolio because it can include your own customized list of futures, stocks, indices and even fundamental data. If you dont have a portfolio, consider making one for next time!
Click [Save and Rebuild] to create a fresh file of data for analysis. It will hold the number of days shown in the Include __ days box at the top of the screen, which is typically somewhere around 24 or 25 days for an exercise like this. MarketScanner then returns a list of all the selected markets, along with a chart of the first one listed as shown at right.
Adding Studies
For illustrative purposes, lets try screening all the markets in your selected portfolio with the Relative Strength (RSI) study that is supplied with Unfair Advantage. To do so, well click the Analysis menu, and then select Insert Standard Indicator. This brings up another menu, from which we can choose RSI.
Study values display in a new column in the spreadsheet at left. This study, developed by J. Welles Wilder, is a popular momentum oscillator. It compares the magnitude of any markets recent advances to the magnitude of the same markets recent declines. The results are presented in an index that ranges from zero to 100. Wilder suggests the direction of the trend is more important than the specific values, but he uses 30 and 70 as reference points for determining oversold and overbought situations, respectively. Markets with low, but rising RSI values might be considered for purchase if a bullish trend can be confirmed. Thats what well attempt to do with this exercise.
Well use RSI through MarketScanner to find markets that have suffered recent downward pressure (potentially oversold), as indicated by RSI values less than 30. To do this, we click the Table Headings menu and then click Filter by. The selection screen, shown below, allows you to enter the filtering parameters. Well request Display only when less than (<) 30 and click [OK]. Voila! Our list of markets is reduced to only those with a low RSI value.

More Analysis Through Charting
Now we can do in-depth analysis on our short list of trading possibilities. Click any market from the table to display it in chart form. Our example shows Lean Hogs. Lets investigate it further by adding Stochastic to the graph. Click the drop-down menu over the chart and choose Stochastic. This study produces the fast and slow K lines and the %D reading. It can also produce signals and equity readings. As you can see on the chart at right, the Stochastic readings for this market seem to have bottomed out and are rising, so it definitely bears watching as a buying opportunity. (A buy signal from the RSI would be for the indicator to rise above 30.)*
*This evaluation is provided for illustration only. CSI does not recommend trades or specific sets of studies for basing trading decisions in this newsletter.

This is just one example of a way to use MarketScanner and Unfair Advantages built-in studies to find viable investment opportunities. There are many more. When you discover consistently successful analysis strategies, add them to your roster.
Get a Stream of Quotes
Lets say you investigate all the markets in the trimmed-down MarketScanner table and decide to make a trade. Naturally, youll want to find out how the market is doing today, and youll want to follow your intraday success once the trade is executed. UA offers a way to view information on a 20-minute-delayed basis on any market, including stocks, futures and options in your portfolio or watch list. Funds may be included for end-of-day quotes. The process is made available through an Internet connection indirectly from the market source via UAs Position Manager module.
Launch Position Manager through UAs Trading Tools menu and then click the Positions menu to get started. Add each market you want to update intraday. See page 6 for the Position Manager form that allows you to manually enter the entry and exit prices, stops, position size, direction, etc. Once these are entered, you can view and print useful account information through the Reports menu. Alternately, just type the symbols for a watch list.
All the series listed in Position Manager will be instantly updated in the Current Price column as shown below. If more than 25 items are listed, a notice will display advising you that intraday updates must be requested manually. Click Refresh and UA will begin downloading recent quotes for everything in your portfolio. Position Manager is not intended to supply continuous quotes. Excessive use (more than a few minutes at a time) may cause source websites to permanently disallow access.

The above is a Position Manager list showing a mix of holdings and markets to watch. Your screen will show those you entered yourself or imported using various import utilities. If the market you want to trade still looks attractive with that recent quote, perhaps the next stop is your broker!
Data Accuracy
Those Position Manager intraday quotes are from third-party websites, so they havent been checked by our database staff. We cant guarantee that these or the very similar SnapQuotes are as clean as the CSI database maintained through UAs daily update service.
Our end-of-day data is cleaned and studied by in-house experts, resulting in an immaculate repository that was deemed by an independent study in Futures Magazine to be the most accurate among all competitors. As a testament to the magnitude of CSI's stellar performance, the second place finisher in that study committed 244% more errors than did CSI! Another competitor committed 488% more errors and omissions, and the worst performing competitor committed 11,888% more errors than did CSI. The data service accuracy study author also found that data accuracy does make a difference. He ran a simple trading system on CSI's clean data and on the other databases tested. Amazingly, the study done on CSI data produced significantly more (around 50% more) hindsight profits than the study done with data from the second place competitor. Clearly, making trades based upon flawed data is an invitation to lose money in the markets.
Data as Your Secret Weapon
One way Unfair Advantage users have an advantage over other traders is by exploiting CSIs abundant, unusual and specialized data. One example is the Commitments of Traders (COT) data we offer. The Commodity Futures Trading Commission (CFTC), under the control of the U.S. Department of Agriculture, provides weekly reports that identify open interest holdings by trading categories: 1) Small Traders; 2) Large Traders; and 3) Commercial Trading interests. Each group is reported upon in the two categories of long and short interests. This effort results in Commitments of Traders reports that are very useful to traders who want to follow the lead of the larger interest groups. Unfair Advantage makes this information available every Tuesday. Additional commentary that I find to be invaluable is available through the Bullish Review (our COT data source), which is published by Steve Briese. No trader should enter those regulated markets without first consulting the information provided or the information easily obtainable from the Bullish Review.
The Put/Call Option Advantage
When pondering the merits of entering a particular futures market, look at the positions taken by options traders for the same commodity and then consider taking the opposite stance in your futures position. Why? Because the put/call ratio is known to be a contrarian indicator. When options to sell (puts) exceed options to buy (calls), it might seem as if the pressure is downward, but in fact, there is a definite tendency for the underlying market to advance. Similarly, when calls exceed puts, the underlying market will likely retreat.
We believe this is because traders sometimes use oppositional options as a form of stop-loss protection for their holdings in the futures markets. Thus the trader who is bullish on cattle might buy a long futures contract and also a put option for cattle. This apparently bearish entry into the options market gives rise to the contrarian result. We haven't seen this argument advanced elsewhere, but we believe it explains the contrarian phenomenon.
A rather simple examination of the put/call ratios of volume and/or open interest for a given market should be consulted before launching a trade. Applying the contrarian view, a ratio of less than one (<1.0) suggests a downward market in the near future. A ratio greater than one (>1.0) suggests a rising market. Putting this into practice by trading in the direction of the put/call indicator is likely to improve the quality of the buy or sell signals offered through your trading software, and may easily improve your chance of success. History has shown an overwhelming tendency for the put/call indicator to move in concert with the markets' directional movement. DO NOT GO AGAINST THIS INDICATOR!
There is an additional caveat to the put/call ratios. When the ratio is computed with volumes the, effect is more likely to be seen in near term decisions. When the ratio is formed with open interest, the effects are more long term. CSI supplies both versions of this ratio on a daily basis for nearly all of the hundreds of U.S. futures markets. CSI's option database is probably the only reliable world source of this hard-to-find information for the U.S. futures market. The options data is available by the business day end.
Market Seasonality
CSI also provides a Seasonal Index that is a useful tool for traders investing in seasonal markets. It is built on a daily basis with 251 points of cumulative seasonal behavior for each day of the traditional world market calendar. As youll see, its predictive prowess improves each and every day of every year, with subtle improvements in expected seasonal shape as additional days are processed. This indicator is invaluable to traders seeking to optimize the timing of market entry or exit as the seasonal trend changes direction.

Collaborative Efforts
The many vendors of trading systems who refer their customers to CSI are supported, not threatened by our set of tools, as these are supplements that help keep investor accounts in the black. We encourage the exploration and use of multiple systems, as many fine ones are available, and each has its benefits. We reward every vendors patronage with an active audience of thoughtful traders who are vitally interested in earning profits based upon accurate information.
Your Decisions
Getting back to your dream team for market analysis, this set of tips should help you determine which players (studies) to put in your lineup. I hope it helps you see that you can substitute heavy hitters for those that are in a slump, and that errors (in choices and in data) can cause losses. Investing isnt Virtual Baseball; it isnt a game at all, but it can be interesting, challenging, and even fun. Best of all, when done well, it can be very profitable. Where will you go from here? Its your call.
Attention VantagePoint Users:
Market Technologies asked us to help spread the word that their new software, VantagePoint Version 6.2 is now available. This new release contains retrained Neural Networks for all 43 current markets plus 9 new financial markets. The new markets are 6 FOREX pairs (Spot Currencies) and 3 ETF markets.
For information, contact Market Technologies, LLC.
Phone: (813) 973-0496
E-mail: trisha@tradertech.com
Website: www.tradertech.com
If youre not using CSIs incredible repository of information and market trading wisdom, why not? In an attempt to be of significant assistance, we encourage our vendors to make use of CSIs many innovative and helpful data products in their analysis efforts. Put/call ratios, seasonality, and COT data are invaluable to most trading platforms. Ask your favorite developer to call us. We can help, and we encourage extended use of these helpful tools.
You wont get the perfection you need anywhere else, and the price is downright minimal. The content (stocks, futures, options on most world markets) and data repository are far greater than this brief newsletter can attest. You can get your subscription started now for cents per day. Please call us. We can and want to help you conquer the markets!
Toll Free: 800-274-4727
E-Mail: Info@csidata.com
Website: www.csidata.com
Put/Call Ratio Data Coming Soon
As this Journal goes to press, put/call ratio data for options is available only to those CSI customers who subscribe to the full options database. We are in the process of distinguishing put/call ratio data so that it will also be available under a separate subscription category. This change will make these valuable series more affordable for futures traders. Watch our website at www.csidata.com for details on pricing and availability.
COT Data Timing
The CFTC typically publishes their open interest data for regulated markets on Fridays, but because the data is based upon open interest conditions at the close of markets on the previous Tuesday, data is dated as of that previous Tuesday.
This practice could leave the trader with the false impression that the data was actually available a week earlier than what could have been physically possible. Steve Briese makes this data available to customers of the Bullish Review on the Tuesday following the CFTCs published report. That report is likewise dated one week earlier.
In spite of the one week coincident delay in reporting, the CFTCs report and the very affordable Bullish Review commentary do a great job in assisting traders by measuring the sentiment of various market groups.
Bullish Review contact information:
Toll Free: (888) 423-4950
Email: Sales@InsiderCapital.com
Notice:
The views and information expressed in this document reflect the opinions and experience of the author Robert C. Pelletier. Neither CSI nor the author undertake or intend to provide tax advice or trading advice in any market or endorse any outside individual or firm. All recommendations are provided for their informational value only. Readers should consult competent financial advisors or outside counsel before making any software purchase or investment decision. CSI does not stand behind or endorse the products of any outside firms.
Website Links: This CSI website and Unfair Advantage system contain hyperlinks and automatic links to websites operated by parties other than CSI. No association with or endorsement of third-party websites should be inferred through these links. They are provided for your convenience and reference only. CSI is not responsible for and has no control over the content of third-party websites.
All information and data on this website are © Copyright 2002-2005 by Commodity Systems Inc.(CSI) All rights are reserved.
800-274-4727 | 561-392-8663 | 561-392-1379 (Fax)