
[Click here to return to journal index]
October 2005
CSI Technical Journal
Volume XXIII, Number 10
In This Issue
Advertising Opportunity
Interested in reaching 6,000 to 8,000 active traders with ultra-targeted advertising? Consider an ad in the CSI Technical Journal. Its a great way to reach CSI customers and others who have actively contacted CSI for information on market data. This is a first-time opportunity that may not be repeated. The CSI mailing list of non-customers can also be rented for one-time use. Contact CSI Marketing at 800-274-4727 or click here for details and pricing.
Like Dew or a Dragnet, CSI Covers World Markets
Historical Information, Up-to-the-Moment Market Visibility and Unsurpassed Analytical Support
There used to be a newspaper in Atlanta with a slogan I admire very much: Covers Dixie Like the Dew. It has been several years since the Atlanta Journal merged with a competitor and dropped the slogan, but the cultural loss lingers. We have too few metaphors as rich as the hometown newspaper completely covering absolutely everything in the region -- like the thick, southern dew.
That is exactly the sort of electronic coverage we strive to achieve at CSI. Ill grant you the dew analogy is a bit wet and messy for a database of crisp and timely facts and figures, but the sentiment still applies. Like the old Atlanta Journal, CSI attempts to be ubiquitous in our coverage of whats important to our customers. Our beat is not Dixie, but the global realm of financial markets, government entities and analytical tools.
Database Beyond Compare
Evidence of our attention to extreme financial coverage can be found in the CSI futures database, which stretches beyond all others to include daily pricing from over 80 exchanges, plus a wealth of cash series, economic data, industry indices and commitments of traders statistics from around the world. The stock database covers eight exchanges in North America, Europe and Asia, and includes ADRs, which are American Depository Receipts that represent foreign (non-U.S.) companies that are traded on the NASDAQ and the NYSE. If youd like to learn more about whats here for you, launch your Unfair Advantage® (UA) software and click the Database menu. There you can choose between the Market Specifications factsheets and the Exchange list. Either will give you an eyeful of data that is unmatched in accuracy, scope, content, and depth.
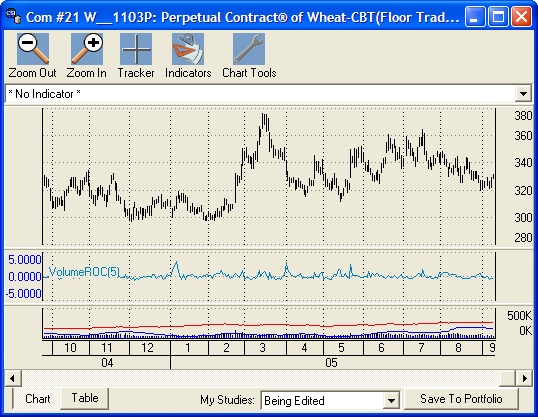
Perpetual Contract data for Wheat with a Volume Rate of Change Study produced through Unfair Advantages Interpreted Study feature.
If you choose to view the Market Specs factsheets, youll find an abundance of data that doesnt show up in a typical chart or analysis program. The Market Specs commodity factsheets fill you in on things traders need to know: the symbol, the contract size and unit of measure, the start date of the history, whether or not options are traded on this market, trading hours and even average total volume. The stock factsheets provide a different set of fundamentals, including shares outstanding, percent institutional investors, sector and industry codes, beta, first trading day, exchange sponsor, contract size, symbol, currency and more.
One of the many aspects traders like about CSI is that we make data available shortly after it comes to us, so markets are updated roughly as the sun sets around the earth. The slight delay between closing and posting times is deliberate and unavoidable. Thats when we clean the data! You can retrieve market updates from a single computer as many times as you like throughout the day to stay abreast of remote market closings, or pick up intraday SnapQuotes from markets where trading is still in progress. To find out what markets are posted when, click that Database menu again and choose View Posting Status. Youll find a complete schedule there, along with updates on our daily progress.
Most of our subscribers retrieve at least some commodity data for reasons that include a historical futures database that is broader, deeper and cleaner than any other. Although stock-only customers are mostly commercial users of our services, individual investors who manage their own accounts often remark about the unusual depth of coverage and content for the global stock information they find at CSI. Our dividend information is particularly prized and rare. Among CSIs more esoteric offerings are delisted stocks. These are valuable input for in-depth analysis of markets in a variety of economic situations. Because they appeal to a limited group, delisted stocks are available by special subscription. We cover just about every mutual fund (some 15,000) so that our customers can not only track their investments, but also study the trends funds reveal. Offering the advantage of professional management and minimal investment requirements, mutual funds are a great way to diversify your stock portfolio. They also provide a slightly distanced platform to profit from commodities, bonds or even the economic growth of a country.
Other data banking companies offer subsets of the information captured by CSI, but such resources are limited in content and substance. We once did a marketing study to find out what it would take to be more competitive with a low priced supplier of stock data. It turned out to be a futile exercise because this so-called competitor offered only 7,000 stocks against our inventory of 50,000. Taking this all into consideration, CSI wins hands down as the most complete data service anywhere, and the best value to boot.
The Net
With all of these diverse data sets, our collection methods must sweep broadly and carefully across several continents. The database staff relies heavily on satellite transmissions, the Internet and e-mails from various contacts, as well as faxes and, yes, phone calls. Weve come a long way from the old days in the late 1960s when we received data on a 110 baud teletype machine, but theres still considerable handiwork and expert skill involved in getting it right.
CSI was recognized for the accuracy of our data content by Futures Magazine and K-Data, Inc. in the only independent data quality test ever done. The study, conducted several years ago by Sheldon Knight who wrote the Futures article, showed that CSI was the best from among all known competitors, including industry giants such as Reuters, Bridge, CBOT MarketPlex and CompuServe. Tables of Knights findings show that our closest contender committed 144% more errors than did CSI; Genesis had a much poorer showing, committing 388.8% more errors and omissions than CSI. That Futures article also reported on the day-to-day profit consequences of using data supplied by CSI, the winner in the experiment, vs. two giant software/data vendors with lesser quality data. Knight provided an application experiment using volatility breakout logic. CSI's data generated a profit of $130,000 over the 20+ month life of a soybean contract vs. $100,000 for the two competitors: Historybank.com
(Omega Research) and Bridge/CRB. These results prompted the author to declare, "Data Make A Difference.
You may have noticed that our trademarked acronym, CSI, sees a lot of publicity these days, as it is now shared by a group of popular television shows about criminal investigations (CSI Miami, et al), and CompuServe Information Service, who lost a trademark dispute with us. We claim no connection to any of these shows or entities, but we do feel a sentimental association with another cop show of long ago; I like to think that at CSI, we capture financial data like a Dragnet. Just the facts, maam.
Expanding Analysis Tools
When it comes to servicing customers in the investment industry, it is difficult to separate data from analysis software. The two are hand and glove. This is why we work so closely with several software vendors to make sure that our mutual customers are well served by the CSI database. In addition to being the preferred data vendor for fine third-party programs, CSI also writes and compiles analysis tools. We maintain a staff that includes a brilliant programmer who works full time on Unfair Advantage enhancements. Along with his ongoing work engineering software changes, he also adds new studies and indicators to UA every month. These studies may be original or public-domain classics, or they may be submitted by users. They can sometimes be found on free websites or in magazines.
These studies can be easily run through the Interpreted Studies section of UAs charting module. If you have a basic knowledge of Visual Basic, you can move forward even farther by modifying, testing and certifying these studies to meet your individual needs. We recommend our own "AnyLanguage" programming language to unlock these studies. "AnyLanguage" is a "Basic/Visual Basic/Fortran" set of coding conventions that can be used to explore certain studies. It is part and parcel to UA's inventory of market analysis capability. Some studies may also be manipulated through the Perl and Visual Basic programming languages.
Considering the time and effort we put into building the Interpreted Studies offerings, this feature is woefully underused. To help more subscribers harness this paper tiger, I will present an example, complete with instructions, here. Youll find that this module is powerful, but much less intimidating than you might have imagined.
Create a Chart
Begin by choosing any data set you wish to analyze. For this example, Ill use CBT Wheat (W) in 3-month-forward Perpetual Contract® form. This is done by launching UA and clicking the Chart button. Next select Futures for market type and enter W (no quote marks) for the symbol. Click the Perpetual tab and make sure the user input is shown in the graphic. (These are the original defaults.) Click [OK] to display your chart.
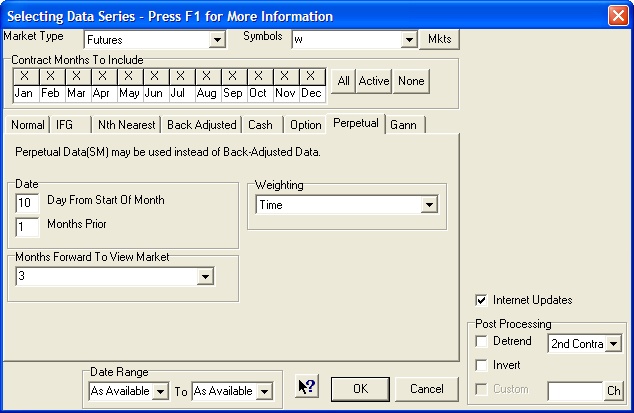
Making a chart of Perpetual Contract® Data.
Add a Study
Next click the Indicators button at the top of the chart, which displays the Study Toolbar. Click the [Add Study] button at the bottom. When the Select Study window appears, click the [Interpreted] button on the left. The Code Editor screen displays. Youll probably want to use the language of our most extensive study list, so click the File menu and then select Change Language Mode. On the resulting menu of available languages, make sure AnyLanguage is selected. Back at the Code Editor screen, click the Indicator From List menu.
Because the list of indicators is so immense, it is broken down into various study types. Choose your preference from among Classic, Conversions, Ez (easy), and Moving Averages. The other choices also include useful tools for analysts, but they are not stand-alone analysis programs.
For this example, well choose the Ez menu and then VolumeROC(5). This study computes the rate of change of volume over a 5-day period. Just as strong volume is often used to confirm price movement, a rapid rise in volume can indicate that a new trend is about to begin.
To use the default parameters, just click [OK]. If you want to change them, you may do so by substituting your desired variables in the top window before clicking [OK]. The Study Toolbar will redisplay with your study highlighted. Also on the screen is your original chart (compressed) along with up to four empty charting panes.
Drag and drop the study from the toolbar into the desired pane and the calculation will begin. (This may take a few moments.) When UA is finished with this study, click the X to close the Study Toolbar. Your chart will redisplay normally. As youll learn through experimentation with various studies, some indicators include buy and sell signals, which are, of course, provided as suggestions to consider, not trading advice from CSI. When these are included, you can view a system equity report by clicking your right (not left) mouse button and choosing the report from the menu.
Programmers Tools
If you would like to adjust your study by changing parameters or even changing the programming code, you can easily do so. Simply click the Indicators button above your chart again and then select your study from the Study Toolbar. Click the [Edit] button to return to the Code Editor screen where you may make adjustments as desired. Review and learn the syntax from the existing code, make your changes, then re-apply the study. The provided studies can be used as models or launching pads for your own analysis techniques. Here the possibilities are almost limitless.
A Global Community
As the world seems to shrink, thanks to globalized communications, our customer base grows. CSI customers comprise a relatively small, but global, community of people who share a quest for in-depth knowledge derived through our services. In some ways, our subscriber list is a Whos Who of respected analysts and investment companies. It also brims with private investors, doctors, lawyers, retirees and others who quietly and methodically use CSI data and software to help guide their accumulation of wealth. Although our customers information is always guarded and private, be assured, as a CSI subscriber, you are in good company.
It is for the benefit of this community -- our customers -- that we strive to provide the most complete financial coverage anywhere. Were like dew, only drier.

Bob Pelletier
Any reader wishing to review the K-Data/Futures report can receive a copy of the complete article by calling CSI to request a
complimentary 8-page, 4-color reprint.
Tech Talk
Each month in this column the CSI Technical Support staff addresses topics of interest to many CSI subscribers. This month they discuss colors in Unfair Advantage charts, making a daily summary printout, the difference between Refresh and Rewrite and the availability of upcoming data products.
Q. Does Unfair Advantage allow me to change the colors on my charts?
A. Yes; virtually all of the colors in the charting window can be adjusted. Everything from the background color to price bars, candlesticks, SnapQuote prices, edited values, overlaid price series, volume, open interest, text, tables and each of up-to-13 technical indicators can display in the color of your choice. To make your selections, create a chart and then position your cursor anywhere in the charting window. Next click the right (not left) mouse button to display the right-click menu. From there, choose Change Color Scheme.
UA will display a Choose Chart Colors form showing every possible data type and region in a color-coded table. To change any of these, double-click the desired field and then select the color from the choices shown. You can formulate custom colors as desired. UA will re-draw the chart with your new color scheme and will remember these changes for all future charting sessions. If you decide to return to the original colors, use the right-click menu again and select Reset Color Scheme.
Q. Is there a way to make a printout of todays summary data for the markets in my UA portfolio?
A. Yes. You may create a printout of todays open, high, low, close and net change for all the markets in any or all of the portfolios defined within your UA system. These statistics are also available for any single commodity or stock, or for all commodities in your subscription category. This reporting feature is handled through the Settlement Report (Sttl Rpt) button on the UA toolbar or the Database menus Daily Summary Report. Your report will display on the UA screen where you may view it and then, if desired, print or copy it for export into another program. The Copy feature is not available when all commodities are included.
Q. Whats the difference between the Refresh File and Rewrite File buttons on UAs Portfolio Manager panel?
A. Refresh File, which is also available through the Database menu as Refresh Price History, is used to replace a corrupted database file by downloading new data from the CSI host computer. It should be used after confirming file corruption with the Database menus DB Integrity Search feature.
Rewrite File, also found on the Portfolio menu, is used to implement changes you have made to your total portfolio or to any series listed in a portfolio. For example, say your portfolio includes back-adjusted files that you regularly export for use with a third-party software program. If you change a portfolio setting such as, Add a Fixed Amount to Make Non-Negative, for back-adjusted files, that change wont be reflected in your export files until you either rewrite the files with this feature or complete your next daily update. Similarly, you would use this feature to make changes, such as the roll-forward date for individual back-adjusted series, effective immediately in your export files.
Q. The June CSI Technical Journal mentioned the future availability of option put/call
ratio data and the September issue said something about a CSI Market Index. Are these series available now?
A. Sorry, no. We have put the Put/Call Ratio data project on hold and may or may not offer that product in the future. Our apologies for the inconvenience. The CSI Market Index is still undergoing testing, as we are researching ways to use this as a stand-alone market indicator. Watch this newsletter for updates.
Notice:
The views and information expressed in this document reflect the opinions and experience of the author Robert C. Pelletier. Neither CSI nor the author undertake or intend to provide tax advice or trading advice in any market or endorse any outside individual or firm. All recommendations are provided for their informational value only. Readers should consult competent financial advisors or outside counsel before making any software purchase or investment decision. CSI does not stand behind or endorse the products of any outside firms.
Website Links: This CSI website and Unfair Advantage system contain hyperlinks and automatic links to websites operated by parties other than CSI. No association with or endorsement of third-party websites should be inferred through these links. They are provided for your convenience and reference only. CSI is not responsible for and has no control over the content of third-party websites.
All information and data on this website are © Copyright 2002-2005 by Commodity Systems Inc.(CSI) All rights are reserved.
800-274-4727 | 561-392-8663 | 561-392-1379 (Fax)