
[Click here to return to journal index]
November/December 2005
CSI Technical Journal
Volume XXIII, Number 11
In This Issue
Holiday Schedule
CSI will be closed for voice communication on Thursday, November 24th for the Thanksgiving Holiday. The CSI host computer will be accessible as usual, and data from world exchanges that are open on this day will be available at normal posting times.
Futures, Forwards, and FOREX
Understanding the Perils and Profit Potential
Limit days can be disheartening to commodity traders; that is, to those who are on the wrong side of an otherwise winning position. When the markets seem determined to defeat you and youre forced to throw good money after bad, you may start to wonder what ever possessed you to dabble in futures speculation. Then you remember that for every guy losing his shirt in todays big price move, theres another buying Gucci shoes and a Mercedes with his profits. What a roller coaster! Sometimes its hard to imagine that these often-turbulent futures markets were conceived and designed to provide financial stability and safety. They were and, believe it or not, they do.
Futures
Futures markets, which had their modern commercial start in the U.S. and Great Britain, were put together for a definite purpose: To provide a forum for buying and selling products before they were actually available. The futures markets provide both the seller and the buyer with an opportunity to contract for a given quantity of a commodity at a price per bushel, bale, pound or ounce, etc. months before delivery. This model benefits producers by allowing them to pre-sell their crop or resource at a known price, thus ensuring against downward price fluctuations. It benefits buyers (typically manufacturers) by allowing them to anticipate and plan for the cost of resources needed for production, while still deferring most of the cost. Stability and safety were needed and provided. For good or bad, speculative investors have made their way into the fray, bringing with them greater liquidity and greater risks for all.
Originally in the U.S., only grain crops like corn, oats and wheat, which were required by businesses to produce food for general consumption, were traded in futures markets. In the United Kingdom, the futures markets focus began with metal products like tin, copper, zinc and lead. In all cases, businesses were willing to arrange for future delivery of a fixed quantity of such products at a predetermined price. An understanding of the current price and carrying costs, combined with hunches about seasonal and economic trends were sufficient for the buyer and the seller to discover what might be an appropriate price for future delivery of that fixed contract.
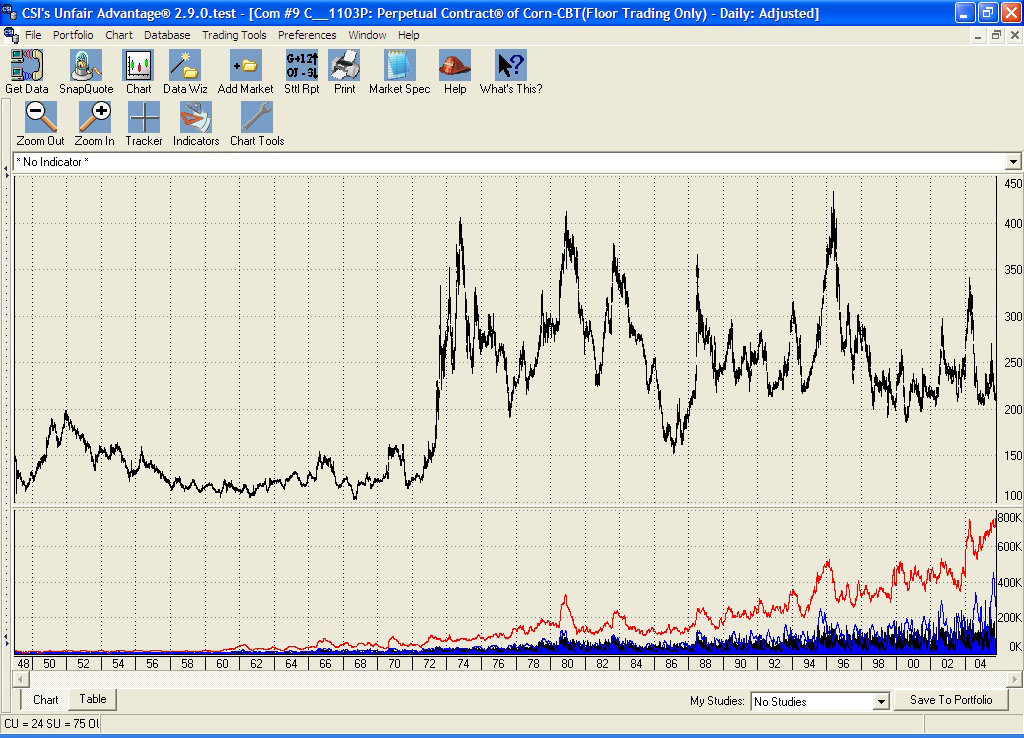
CSIs unsurpassed historical database holds CBT Corn data to 1949. Here UA shows the entire series in highly compressed Perpetual Contract® data form.
In the U.S. we use mostly traditional contracts that assign a fixed, future calendar date for delivery of the product. In such transactions, the seller hopes that the market price might fall before the delivery date, so that the amount collected for the commodity will be greater than its value upon delivery. Conversely, the buyer hopes that the price will rise so that the commodity will have been purchased at a bargain, or at the very least, a price comparable to the cash market at the time of delivery. Speculators take positions on either side of this transaction, with the hope of liquidating the contract for a profit before being faced with delivery of the actual product.
Forwards
The London Metal Exchange (LME) provides trading in a different form of futures market known as forward markets. Put simply, a forward market has a fixed date of delivery that is 90 days forward or 180 days forward or more of any given trading date. In this situation, each day traders agree to take opposing positions (a buy side and a sell side) for the predetermined (exchange-specified) period forward when delivery is set to take place. In this arrangement, it is a bit difficult to know precisely the value of your contract as time goes by, because each and every day a new 90-day-forward contract and a new 180-day-forward contract is born. Only the value of those new contracts is known for certain.
CSIs LME database reaches back to 1968. A LME source told us that CSI may be the only provider of such extensive historical information on their exchange.
I well remember visiting the LME in the mid 1970s at the invitation of Globe Commodities, a now-defunct London futures firm. My personal tour included a visit to the LME trading pit where I witnessed perhaps 20 to 25 smartly dressed gentlemen seated in a ring (a circular bench that resembled a church pew) in the center of a roughly 15-foot-by-15-foot room. Behind that circular pew were banks of phone booths for communication with clients and offices. These were used by associates to report audible transactions. Unlike the raucous jumping and shouting in the pits of the CBT and CME in the United States, the LME ring was quiet and dignified. During the ten- or fifteen-minute session, members made deals with their counterparts seated across the ring in muted conversations, such as, I say old chap, I would like to offer a quantity of copper at eight hundred twenty-five. If the party on the other side of the ring accepted the audible offer, the transaction was consummated. Im sure things have changed greatly since that visit, but I was amazed at how orderly was the process.
Order and civility tend to be hallmarks of our neighbors across the pond, but even there, dangerous mistakes can happen. My visit to Globe Commodities coincided with an unfortunate event precipitated by their selected trader, who apparently failed to understand the protocol to transact trades. He unwittingly forced the company into receivership by failing to take or provide delivery on transactions that reached their 180-day due date during my visit. I had the unpleasant experience of witnessing the very end of Globe Commodities existence because of the inept performance of a single trader. Trading can be a very dangerous business, as was painfully demonstrated during my visit.
The Nature of Futures
Unlike stock exchanges where shares are traded at immediate prices based upon current evaluations of a business expected profitability, futures contract prices are based upon the expectation of the future price of the raw material at a predetermined forward date of delivery. Open outcry or computer-matched price discoveries generally rely on expectations of supply and demand at that forward point in time.
Acts of God and acts of government can have major impacts on eventual pricing. To some degree, most markets are affected by weather conditions. Nearly all are affected by the availability of transportation and the cost of processing. This season we are witnessing hardships on corn farmers in the Midwest who have been hampered by drought, transportation problems and soaring fuel costs. The inability to move products down the Mississippi from the farm belt to the New Orleans seaport (thanks to Hurricane Katrina) affected the price of grains for future delivery. The futures markets are bringing farmers some relief by allowing them to defer shipment of their crops, but that storm also affected oil rigs in the Gulf of Mexico, which became damaged and consequently pushed up the price of oil on the world markets.
Ironically, favorable weather with just the right levels of rainfall, sunshine and temperature in the growing area negatively affect prices. This set of good fortune produces an overabundance of supply. Conversely, the same hailstorm that wreaks havoc on a crop can send the price per bushel soaring. Mining finds, inflationary influences on the medium of exchange (dollars, yen, or pounds, etc.), prospects for war or peace, among other things, can contribute to future price trends. One must consider many supply-and-demand factors before arranging to purchase or sell a product with a fixed future delivery date.
Futures Risk vs. Stock Risk
Anyone can participate in the futures markets, but it takes a keen vision of how the markets work to be successful. I dont believe that, for the trader who does his or her homework, futures are any riskier than stocks. In fact, stock traders sometimes fail to realize that their investments may be just as risky as those of futures traders. Both are influenced by factors beyond your (and your brokers) control. However, with the peerless database of as many as 1,000 futures products offered by CSI (and drawn from over 80 world exchanges), it is possible to recognize and capitalize on those factors that affect futures as time goes on.
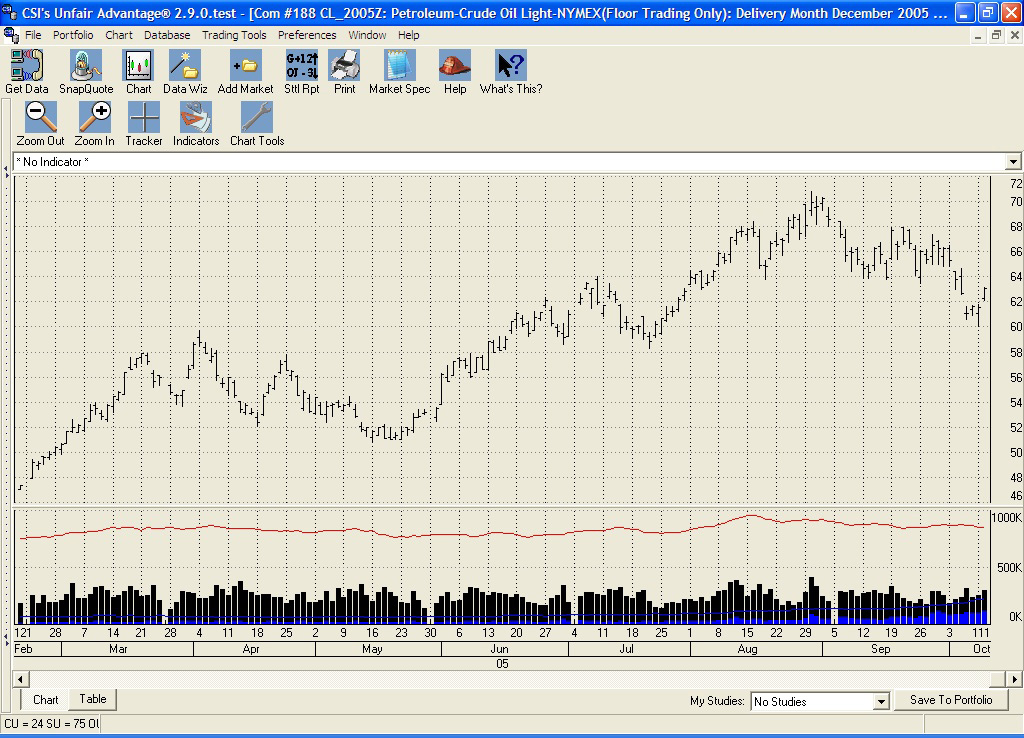
Katrina made landfall around the vicinity of New Orleans near the end of August, 2005, but the threat of significant damage slowly became obvious more than a week earlier. The Crude Oil chart shown above demonstrates that prices had moved to significantly higher ground as the threat to U.S. oil production became more and more likely.
Chance elements (weather, natural disasters, etc.) play a role in futures prices, but the surprises that come from corporate behavior in stocks may hold a far worse effect. For example, with stocks, obscure things like product liability, failure to meet the whisper number and management abuse can be kept secret until it is too late to remedy. The value of a companys stock can drop significantly before the bad news reaches the investing public. Futures traders, on the other hand, can view the transparent behavior of related products that explain logical price behavior of almost all markets. For example, an investor in Aluminum, which is derived from bauxite and electrical current, can measure the value of the future product as it correlates with the cost of crude oil, a key factor for evaluation that cant be kept secret by insiders.
Leverage
The important fact that attracts nearly every futures trader is that, unlike stock transactions where the total value of a stock market transaction must be on hand or borrowed, the futures trader is engaging in a deferred arrangement wherein full payment is not due until the contract is fulfilled at the delivery date. Since that commodity will not physically exist until that delivery date, there is no need to borrow its value. This deferred investment incentive is the most significant difference between trading futures contracts and trading stocks. It brings us to the concept of margin.
Even with this deferred transfer of funds, the producer, the corporate consumer and the market player must advance sufficient funds, called margin, to protect the participating broker from taking on unacceptable risk of loss overnight. Margins are assessed in increasing and decreasing levels that are based on the value of the product at delivery time. A significant characteristic affecting margin is that the winning side of a transaction will see a decrease in the level of required margin capital while the losing side will be obliged to increase his level of margin deposits on a daily basis through margin calls. Although consummation of the futures trade doesnt result in immediate delivery of the product, it does allow the parties to profit or lose money through margin calls immediately.
Margin Calculations
A commodity contract is defined according to exchange standards. For example, a typical corn contract represents the purchase or sale of 5,000 bushels of corn. The contract size may seem somewhat arbitrary, but it is fixed by the exchange according to manageable lots that might fit into a train box car or other common vehicle for conveyance. If corn is priced at, say, $2.50 per bushel, the contract value would be 5,000 times that price, or $12,500. Larger traders and commercial interests simply take positions on multiple contracts to fulfill their business needs.
Depending upon the exchanges published schedule of speculative minimums, the margin for the above corn contract (investment cost) might be roughly 5% of $12,500, or $625. The number chosen by the exchange typically depends upon the given markets volatility over time. The required margin deposit imposed upon a futures investor is calculated to protect the broker from an overnight loss, so a widely swinging market will require more margin than a tame, well-behaved market. What this all means to the speculator is that for only $625 of day-by-day price exposure risk, he can control $12,500 worth of product. A long position in the corn market at, say, $2.50 per bushel could grow to $2.60 per bushel over a short period of time, netting a 10 cent profit on 5,000 bushels, or $500 an 80% return on margin.
As your account equity grows in one commodity, your equity advantage can be used as margin for a larger position in the same commodity (called pyramiding) or for the initial margin in another unrelated market. The benefits of pyramiding can be enormous, but these highly leveraged positions can be risky and work to your disadvantage when the market moves against you. In the futures arena where transaction costs are minimal, serious consequences in the form of margin calls, which may require excessive out-of-pocket expenditures, can arise when poor decisions are made.
FOREX Markets
I believe every trader should understand FOREX markets, because of their impact on the world economy, before investing in any type of commodity. FOREX (FOReign EXchange markets) are international exchanges where world currencies are bought and sold. The FOREX trader deals in lots of approximately $100,000 each. Think of a lot as a $100,000 contract. The FOREX market is so vastly large, liquid and free of external controls that buyers and sellers (who may be individuals or banks, etc.) can open and close positions within seconds. Margin levels lie in the realm of 200- (or so) to-one, so a FOREX trader can control $100,000 by putting up just one-half of one percent of that sum (as little as $500). This is possible because of the extreme level of liquidity.
A word of caution: Although great prospects for profit exist in the FOREX markets, there are equally great chances for failure when directional forecasts are incorrect. These markets can move abruptly and with great momentum, so a conservative posture is highly recommended. In general, it is safer to take a short-term position in the same direction as the prevailing trend. Exercise great care!
A significant advantage of trading in FOREX is the markets sheer size. It is so huge that the forces involved will immediately discover the real value of the relationship between any pair of FOREX markets, yet no single investor can affect the markets movement over time. Factors that affect the relationships between foreign exchange markets are political unrest, economic conditions, unemployment, tax policy, inflation, interest rates and general economic perceptions. Traders must be aware of these conditions before entering a given market because the effects of changes in conditions are virtually immediate. The FOREX market is open 24 hours per day from Sunday afternoon until Friday afternoon (midnight GMT Monday until 10:00 p.m. Friday).
CSIs FOREX data feed is based upon information that is offered in a daily frequency; however, we are looking into offering live FOREX data for our customers. Watch our website for news on availability.
Finding Safe Harbor
Whether youre trading traditional commodities, index futures, government instruments or FOREX markets, speculative trading is a dangerous game. There are, however, ways to investigate possible positions before taking them on and even ways to know whether you are likely to prevail in your trading endeavors. Here are a few:
1) If youre a CSI subscriber and a user of Unfair Advantage® (UA), you have a wonderful program called Trading System Performance Evaluator (TSPE) that can be used to measure the odds that you will survive in the markets with your chosen signal-generation technique. It will tell you whether or not the system you are trading is likely to produce a profit with your specified level of trading capital. The main input is your real or simulated trading record, or a sample record provided by your software vendor. TSPE takes that record, along with your starting capital and other factual details on commissions, etc, and then determines your chances of success through a sophisticated Monte Carlo Simulation. The process is no different from the one I used to certify proposed military system design alternatives while working as a systems analyst for the General Electric Company. Wouldnt you like to know if you have a reasonable chance of making profits before investing your money? Ask your trading system vendor for a complete trade-by-trade record of his trading performance over time, and feed the data into TSPE to learn what can be expected. TSPE is a remarkable tool. It will even assess youre your level of required capital investment. Dont trade without it!
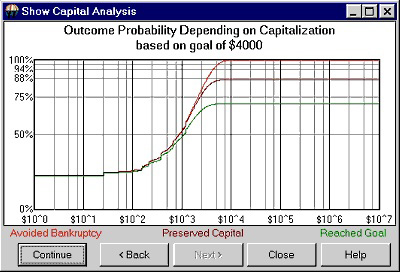
TSPE Capital Analysis: On this chart, the top curve shows the chance that drawdown will be less than your capital stake (see horizontal scale); basically, your odds of avoiding bankruptcy. The middle curve shows the probability of recovering your original capital stake (shown on the horizontal scale). Think of this as your odds of breaking even at varying funding levels. The lowest curve on this chart shows the probability that a given goal can be met with increasing capital stakes (horizontal scale). Low values reflect a low probability of reaching your goal and high values indicate a high probability of reaching that goal. The closer this curve gets to 1.0 on the vertical scale, the better the chance of achieving your goal with a given capital stake.
2) Although producers and manufacturers are in the markets for stability and safety, speculative traders arent. They seldom, if ever, take title to the physical commodity, and even more rarely do they want to! Commercial interests and large traders are the folks who are generally more in-the-know about appropriate future prices of the markets, so its not a bad idea to watch what theyre doing. You can see for yourself by viewing the Commitments of Traders (COT) data available through UA. COT series isolate the interests of commercial traders, large holders of future products, and the small, one- or two-contract traders. When viewing the net positions of these three groups, the wise trader will take cues from the commercial trader interests and the larger trader interests. This information is freely available to all UA subscribers on a timely basis, as key reports are made public in a weekly frequency.
For information on COT data, we strongly recommend you contact Steve Briese at The Bullish Review for a copy of his invaluable weekly report which offers information on the 45 major commodities regulated by the CFTC. Phone: 888-423-4950; Website: www.InsiderCapital.com.
3) Check your markets seasonality with UAs cumulative Seasonal Index Study. Its on the study toolbar. This forward-looking dynamic study offers the cumulative record of any markets past seasonal behavior as more and more information is provided over time. These statistics, which are projected forward for the coming year, provide an excellent view of what might be expected for tomorrow and beyond.
4) Watch for correlated behavior with related markets by visiting CSIs website at www.csidata.com. There you can view emerging market behavior to verify opportunities. The website allows you to correlate commodities with other commodities, and with any of the 70,000 stocks and funds in the CSI database. All active customers can view the correlation statistics. Simply enter your CSI User ID and customer number on our website, and see for yourself which markets correlate with the stock or commodity you plan to trade. Positively correlated markets move in concert with each other, whereas negatively correlated markets move against each other. Those who use this information to their advantage tend to more fully anticipate a markets future direction. This added insight will likely give you the confidence to move forward with a proposed investment. You might even want to protect yourself by engaging other markets as hedges on your positions. The correlation tables will tell you which markets to study or review.
5) It might help your perspective to remember that the frequent Limit days that strike fear in the hearts of speculators exist to keep the economy humming along smoothly. Like the relatively new curbs in place on the stock markets, these market-by-market show stoppers prevent uncontrolled free-falling and rocketing prices. When all is said and done, they are your friend because they truly offer a chance for sanity to prevail.
How can you keep yourself in the black and maximize profitable trades? There are no guarantees, but good trading always begins with good analysis, and a thorough knowledge of each market, including the environment and circumstances in which it exists. I recommend you start by studying the gamut of market data available from CSI using a variety of screening tools. Dont be concerned that these will take the fun out of trading. If youre a speculator, even relatively safe trading can still feel like one heck of a ride. Along the way, each additional analysis step you take can potentially enhance your prospects for success.

Happy Trading
Bob Pelletier
Important Reminder:
There is a risk of loss, which may be equal to or greater than your entire investment, when trading futures, forwards, FOREX, stocks and options. These markets are not suitable for all investors.
Advertising Opportunity
Interested in reaching 6,000 to 8,000 active traders with ultra-targeted advertising? Consider an ad in the CSI Technical Journal. Its a great way to reach CSI customers and others who have actively contacted CSI for information on market data. The CSI mailing list of non-customers can also be rented for one-time use. Contact CSI Marketing at 800-274-4727 for details and pricing.
VantagePoint News
Market Technologies recently announced that VantagePoint Version 6.3 has been officially released! It includes seventeen new market modules for Intermarket Analysis. The new markets include additional Forex Pairs, Indexes, Metals, and Agricultural markets.
For more information, contact Market Technologies, LLC.
Phone: (813) 973-0496
E-mail: trisha@tradertech.com
Website: www.tradertech.com
CSI subscribers can experience seamless compatibility with the new VantagePoint software by upgrading to Unfair Advantage version 2.8.4. Please contact CSI Technical Support for a link to a free downloadable upgrade of our software.
Phone: 561-392-8663
Or 800-274-4727
Tech Talk
Each month in this column the CSI Technical Support staff addresses topics of interest to many CSI subscribers. This month they discuss creating a portfolio with Unfair Advantage, UAs Roll/Delist Report and various aspects about back-adjusted historical data files.
Q. Im having trouble creating a new Portfolio. After clicking on "Create Portfolio," the Edit portfolio screen appears. After naming the portfolio by adding the directory name where I want the data stored to the C:\ua\files\ directory prompt, the OK button remains grayed out. How do I proceed?
A. Youve almost got it, but you need to fill in both entry boxes on the Edit Portfolio screen. Type the name of your portfolio in the Name box. It will automatically appear as part of the directory name in the Directory box. For example, if you want to name the directory, HotTips, type just that into the Name box. The Directory box will automatically show: C:\ua\files\HotTips You can edit the directory name to show any physical location on your drive, if desired, but you still must enter the Name in its own box.
Q. Each day UA displays a Roll/Delist Report showing stocks that have been relisted. I am not sure what this means, or why it appears every day. Will you please explain?
A. For stock database users, the Roll/Delist Report is an optional listing that shows changes to the stock factsheet. If you don't wish to view it, go to Unfair Advantages Preferences and then click Distribution 1. Uncheck the selection box for Display Rolling/Delisting report after distribution. If you would like to learn more about the issues listed, print the report and check the symbols in the Market Specs factsheet.
For futures database users who update continuous or computed contracts in their portfolios, the Roll/Delist Report shows which markets rolled from one contract to the next with your current update. For example, the notation for an IFG (Individual Futures Group) listed in your portfolio might reflect that an expiring contract was dropped and replaced with a more distant delivery month.
Q. What is the purpose of Generate Forward in back-adjusted contracts?
A. Back-adjusted contracts show the actual prices of the most recent contract with a backward correction of price discontinuities for earlier active delivery months. A combination of roll-triggers, roll-timers and accumulation methods is offered in an attempt to make the series mirror the trading style of the user. Back-adjusted contracts are said to be generated forward when the selection of contracts to be included in the series is, in part, based upon what would have been known historically, in real time.
Unfair Advantage offers two back-adjustment algorithms. The standard back adjuster, which is written in FORTRAN, selects contracts chronologically backward in time to assure that no contracts are skipped -- not even lightly traded ones -- in the concatenation process. The alternate back adjuster, written in C++, has a forward-market viewing perspective. This means that contracts might be skipped if open interest is used as a roll trigger and nearby contracts have lower open interest figures than farther distant contracts. The generate forward prompt automatically selects the alternate (C++ language) back-adjuster. Whichever method is used, the back-adjuster will never revert to an earlier contract, even in the event that one was skipped due to aberrations in open interest.
Actual trading experience will not necessarily duplicate results one might be led to expect with any type of computed contract, be it back-adjusted, nearest future or CSIs exclusive Perpetual Contract data, because commissions during periodic rolls to succeeding contracts and fill quality arent necessarily reflected.
Notice:
The views and information expressed in this document reflect the opinions and experience of the author Robert C. Pelletier. Neither CSI nor the author undertake or intend to provide tax advice or trading advice in any market or endorse any outside individual or firm. All recommendations are provided for their informational value only. Readers should consult competent financial advisors or outside counsel before making any software purchase or investment decision. CSI does not stand behind or endorse the products of any outside firms.
Website Links: This CSI website and Unfair Advantage system contain hyperlinks and automatic links to websites operated by parties other than CSI. No association with or endorsement of third-party websites should be inferred through these links. They are provided for your convenience and reference only. CSI is not responsible for and has no control over the content of third-party websites.
All information and data on this website are © Copyright 2002-2005 by Commodity Systems Inc.(CSI) All rights are reserved.
800-274-4727 | 561-392-8663 | 561-392-1379 (Fax)