Starting from Chart or Scan
Previous  Top  Next

The Interpreted Studies are manipulated in almost the same way whether they are applied to a chart or a MarketScanner run, so most of the instructions are the same. However, the starting points are different as described here. Before you begin either method, please make sure your CSI database is current. If not, download a daily update so you have the latest data for analysis.

Starting an Interpreted Study From a Chart


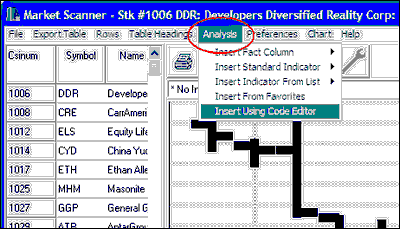
1) Begin by displaying a UA chart, either through the standard charting module or by running a MarketScanner scan.

2) chchartico 
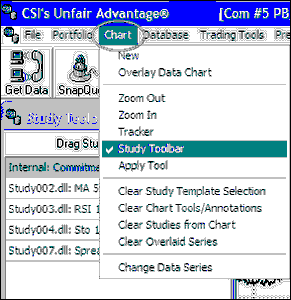
Click the "Indicators" icon on the UA tool bar or click "Study Toolbar" from the Chart menu:

applyst


This brings up the Study Toolbar as shown here:

sttoolbar


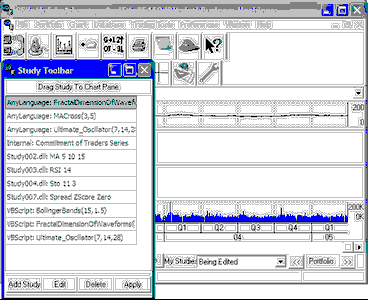
The easiest way to reach the Study Library is to select a study (any study) from the menu and then click [Edit]. The Code Editor screen displays.

Starting an Interpreted Study From a MarketScanner Run

1) Begin by executing a MarketScanner run as described in the MarketScanner chapter. Make sure your scan includes the market categories or portfolios you wish to analyze with your Interpreted Study, and make sure that your database is current.

When the scan is complete, no matter what is displayed in your charting window or in the spreadsheet environment, click the "Analysis" menu at the top of the screen and then click "Insert Using Code Editor" as shown below.

analysismenu

From here, both methods bring you to the same Code Editor form as described next.

MarketScanner also allows you to insert Fact Column, Standard Indicator, Indicator From List, and Favorites from this menu. These are explained in the MarketScanner chapter of this manual.