| Monthly
Article
Topics for January |
||
|
This Issue
Various Topics
Tech Talk
Market Statistics
Notice:
Copyright (c) 1999 Commodity Systems Inc. (CSI). All rights are reserved.
|
Topics discussed in this month's journal.
Studying the Anatomy and the Dangers of TradeStation® A true story example I have been
attempting to unravel the mysteries of TradeStation (TS) for several months
now, and have recently focused my attention on its "Strategy Performance"
report that offers an "Account Size Required" for typical derived systems. The
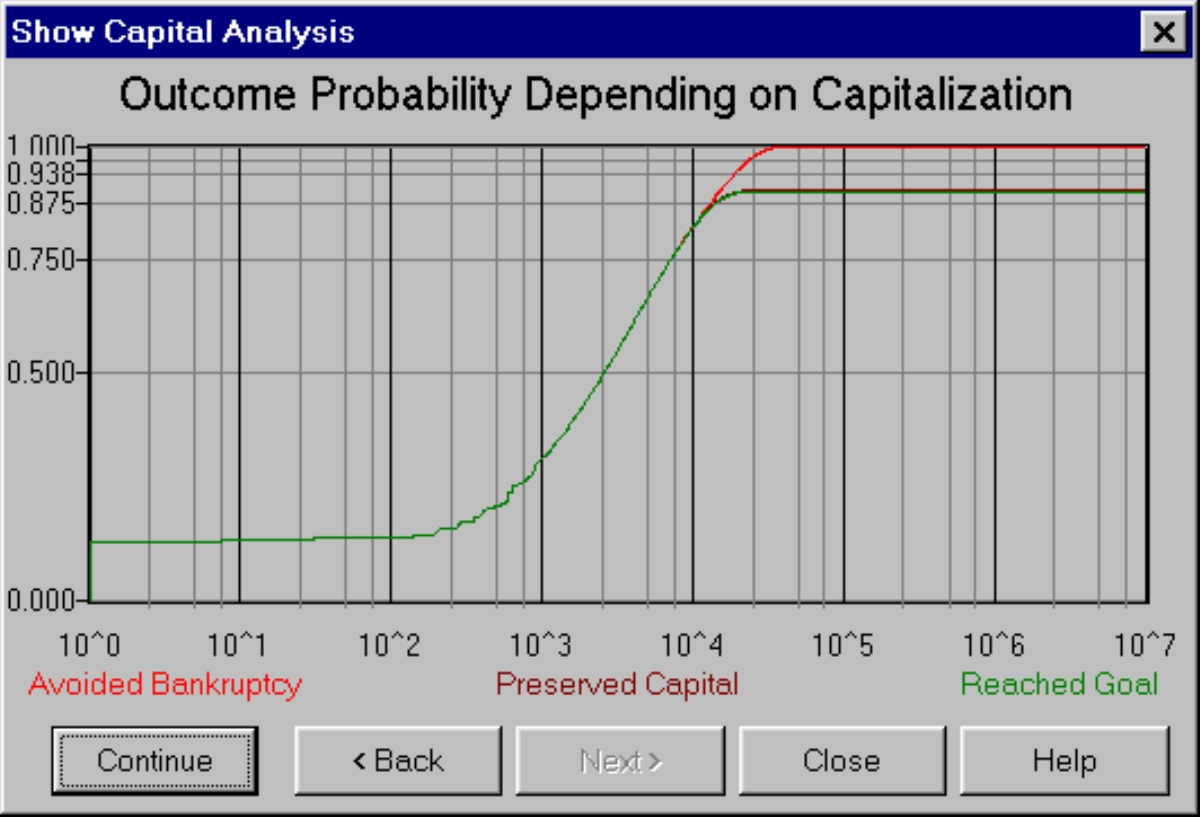
capital I selected the day-session T-Bond contract for the TradeStation study, because it is a very liquid and popular market. Due to the flawed nature of the Historybank.com database that comes with TradeStation, the first step was to substitute clean CSI data for TradeStation analysis. Many things can go wrong when attempting to develop a system, and the last thing I wanted to do was start out with a database that could not be trusted. Omega's Historybank.com, according to the Futures Magazine study published in September 1999, has an error rate that is 485% as high as the error rate of "the best" firm studied, which was CSI. It took about an hour of my time to wrestle through the many options and introduce the range of parameters that TS would use to optimize the results. The method for achieving a profitable system with TS was not simple. I was concerned that I wasn't even given the opportunity to specify the trading commission and the expensive slippage tax, although I do remember having seen such a prompt on one occasion in an earlier exercise. I'm sure happy I don't have to make a regular habit of playing with that package. There are too few hours left in my life to spend another one struggling through that again. TradeStation studied T. Bonds for me over a two-year period from December 12, 1995 through December 12, 1997. It suggested a stop parameter and a slow and a fast moving average that seemed reasonable, based on a narrow range of settings for the three parameters. The Strategy Performance report showed that the system produced a very respectable $4,156 profit (before commissions) with a required account size of only $1,438. Such a situation would reward the user with a "Return on Account" of an astounding 289%. With results like this, I thought, Bill Gates would have to move over, because I had already begun making plans to buy him out well before the Millennium became a blur in the past. The Strategy Performance report also showed that I could achieve those results in just 15 simple trades. With such a small investment, I was aching to call my broker to make that first trade. Back to reality - this is only a test! I needed to get a feel for whether TradeStation was on the up and up, and know whether or not the performance derived in hindsight would be possible in the future. Of course, it seemed remote that anything could go wrong in actual practice. After all, the performance summary showed that Gross Profits exceeded Gross Losses by a 2.4 ratio. How could I go wrong? The next part of my investigation involved evaluating the TradeStation results with Unfair Advantage's® (UA's) new Trading System Performance EvaluatorTM (TSPE). Last month and the month before in this publication, we wrote about how one might certify or at least assess the risk of trading or repeating a given performance record. We talked about how this would be accomplished, and commented on how one might interpret the results. I entered each trade for the two-year test period into TSPE, and factored in a $100 commission and slippage expense per trade to compensate for these figures' exclusion from the TS analysis. In spite of Omega leaving out these real-world requirements, they were forced in place. The end results weren't good. TSPE said my account size should be $30,000 and that my chance of achieving a $2,656 goal (TS's after-commission result) on a $30,000 investment would be about 89% (see right dot on chart). The probability of preserving my $30,000 capital was 98%. The probability of achieving the same goal on TS's $1,438 investment was only about 30% (left dot) and the probability of preserving my $1,438 capital was about the same. How could such a good system operate so poorly in projected operation? And how does TradeStation justify telling me that I will get rich when the likelihood of going bankrupt and losing my $1,438 capital stake is at least 70%?
[The three curves from top to bottom display as a function of invested capital (the horizontal scale) the probability (vertical scale) of remaining solvent, of retaining invested capital, and of reaching a specified goal. The dollar goal is an input not shown on the chart. The larger the dollar goal, the larger will be the separation between the bottom two curves. The more marginal the profitability of a given system, the larger will be the separation between the top and middle curves. To force all curves to approach certainty of goal achievement requires unlimited trading, but residual invested capital will not be eroded should the trader suspend trading early.] Before going further with my search for a profitable system, I frantically searched the TS documentation to understand the declared assumptions concerning the TS Strategy Performance Summary. Nothing! There was absolutely no mention of any declared assumptions! I inductively determined their assumptions from the factual output. Since the $1,438 account size matched up with the account's largest drawdown, I deduced that this was how TradeStation decided the maximum required account size. The apparent underlying assumption therefore, was that trade-by-trade results are not independent. In other words, there is a dependent sequence of trading outcomes that forces the very low drawdown. The resulting account size requirement, return on investment, and all of the superlatives and statistics reported in favor of the derived system were based on the chronological (serial) arrangement of the artificially derived profit-and-loss statistics. Omega could argue that the "Account Size Required" was a pre-simulation proving figure and not a post-simulation limit, but that would be contrary to the purpose of back testing a proposed technical method. The dependence assumption adopted by TS is a puzzling premise, given that markets are reactions to the unpredictable daily effects of weather, government policy, regional politics, employment rates, world trade, natural resource production, product substitutability, supply and demand, and many more factors too numerous to mention. Such influences strongly and absolutely contribute to market randomness, which in turn forces the necessary assumption of independence, not dependence, on the trade-by-trade results. Given the TS performance statistics, it would be impossible for the makers of TS to argue that their performance summary is based upon an assumption of trade independence. A simple change in sequence resulting in a clustering of losses would have measurably inflated the account size requirement, proving them wrong. What is there about TSPE that makes it assess performance in such a conservative light? As we explain in CSI's TSPE documentation, TSPE makes a critical conservative assumption known as "trade-by-trade independence." Independence, in a mathematical sense, is one of those buzzwords that most people dismiss as unimportant. You can see from TSPE's high capital requirement that independence bears heavily upon the result. When one gets into the trading pit, profits and losses tend to cluster together, as alternating profits and losses are statistically infrequent. Commission and slippage are taxes that must be paid. In the TSPE simulation of market trading, trading results are randomly sampled from the P&L list. The randomly compiled string of consecutive losses is allowed to amplify account size requirements, which will conservatively turn the odds against you. Another characteristic of TSPE has to do with parameter control. The moving average crossover study used and analyzed by TradeStation requires two moving averages and a stop limit. Each of these controls (3 in total) contributes to a reduction in simulated profits and a worsening of losses to account for the hindsight loss of statistical freedom. In spite of the above, I still hadn't totally given up hope on buying out Bill Gates. Giving Omega the benefit of the doubt, there was still something I needed to do to prove their result was repeatable. I wondered how that derived system would have done in the two-year period that lies after the two-year development period. If it worked there, perhaps further testing would give me some promise with my newfound TS system. A quick review of the unseen virgin period from 12/12/1997 to 12/12/1999 revealed that my system would have lost $3,843 on 15 more trades, inclusive of commission and slippage. The facts bear it out: TSPE did a good job of keeping me out of the market. Given the TSPE results and confirmation from TradeStation, it appears that not only will I not be able to buy Bill Gates out, I won't be able to buy out Bill Cruz either. The mysteries of TradeStation are, indeed, unraveling. We can only advise caution and wariness. In spite of the ads, always read the escape disclaimer designed to protect the vendor and buyer beware. There is no free lunch. TSPE is said to "certify" a system based upon a review of the hindsight past or based upon the prospects of repeating actual experience. In the former event (hindsight), parameter control comes into play. In the latter case (repeatability of actual results), only sample size bears on the outcome. Parameter control causes degradation and sample size serves to overcome control parameter effects. In either event, the so-called certification is measured against a probability of achievement. In other words, certainty has only to do with the declared probability, always leaving a measured chance of ruin. One should assess that chance carefully. Trade-by-trade example of TradeStation study results: 588
Unfair Advantage version 2.0.1 brings CSI customers into the 21st century with all the right tools for modern investing. This is a brief overview of the data retrieval/analysis system that leads all others in terms of using technology to enhance the trading experience. Communications Naturally, investment software that claims to be modern uses the Internet. Your Internet Service Provider gets you connected to the CSI host computer, then the data request and download are automatic (and fast!). We also offer a direct-dial backup that you can use any time your ISP is inaccessible. Charting The UA screen displays your pre-selected portfolio list next to the charting window and quickly creates your first chart at your command. When you are finished with one chart, simply click a scroll arrow to go to the next. You can scroll through the entire portfolio, greatly reducing any inconvenience the "charting maximum" might have caused with earlier versions. Your most recently built charts will remain available for immediate viewing. Unfair Advantage Analysis:
PAGE 1
|


 stake
for most efforts was minimal, and I was eager to see if I might score
handsomely with the small capital outlay TS suggests. Could it really be as
good as it looked? I put on my detective hat to find out.
stake
for most efforts was minimal, and I was eager to see if I might score
handsomely with the small capital outlay TS suggests. Could it really be as
good as it looked? I put on my detective hat to find out.