| Monthly
Article
Topics for December |
|||
|
This Issue
Various Topics
Tech Talk
Market Statistics
Notice:
Copyright (c) 2000 Commodity Systems Inc. (CSI). All rights are reserved.
|
Topics discussed in this month's journal.
Holiday Schedule CSI will be closed for voice communication on Monday, December 25 and Monday, January 1 for the Christmas and New Years' holidays, respectively. The CSI host computer will be accessible throughout the holidays and data will be available for those markets that remain open on these days. All of us at CSI extend our best wishes for the season and the coming new year.
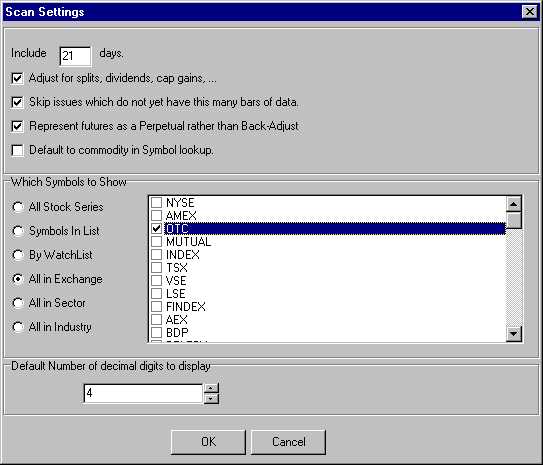
Detecting Emerging Market Opportunities in Stocks and Futures With MarketScannerT We are very pleased to announce that Unfair Advantage's® Stock Scanner T program is almost ready to be reborn as an enhanced module called MarketScannerT. As the name suggests, this powerful, versatile screening and scanning tool is no longer limited to just stocks and indices. It can be used to explore investment opportunities for all 100 CSI-reported world stock and futures exchanges covering many hundreds of markets. In addition to expanding the scope of markets that can be analyzed with the scanner, we have also been working to create new and innovative analytical tools. Below is an example of a new study called Emerging Markets ("EmergMkt," for short) that has been developed for experimental purposes in Unfair Advantage v. 2.2.2. We have been running it daily, hoping to find buying and perhaps selling opportunities. Although our analysis has been confined to stocks, MarketScanner can perform the same analysis on futures markets using Perpetual Contract® data or back-adjusted contracts. EmergMkt is a simple study in that it merely screens stocks for two characteristics and reports a list of all stocks that share those characteristics. These important characteristics are 1) having a flat price range for a period of time, and 2) breaking out (emerging up or down) from that flat range in a significant way. It would be somewhat unlikely for an emerging stock to escape detection through this study, and every stock that moves smartly up is a possible candidate to become the next Yahoo. We have prepared the following example to illustrate this tool. Let's go through an analysis using EmergMkt for a hands-on look at how MarketScanner can work for you. To begin, launch Unfair Advantage normally and update the database. Then pull down the "Initiate" menu and click "Market Scanner." From the "Scanner" screen, pull down the "Options" menu and click "Scan DB (database) Options." This brings up a screen where you can select the number of days to scan and your markets of choice.
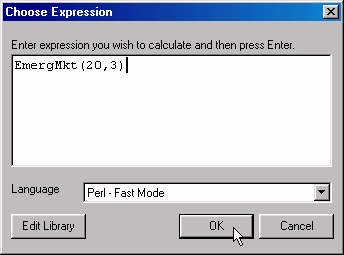
For this exercise, you'll need to specify 21 days in the "Include __ days" box. This example required adjustments for dividends and capital gains, and skipped issues that had less than 21 days of data. For the "Which symbols to show" option, we selected the OTC exchange. We left the default number of digits to display at four (4). Click [OK] to accept your options. There will be a short delay while all the necessary records are gathered. When the new stock list displays, click on "Columns," then click "Insert Custom Indicator" to reach the "Choose Expression" screen. Choose "Perl - Fast Mode" as your interpreter language. Place your cursor anywhere in the white "Enter expression..." window and right-click your mouse to bring up a menu of sample PerlT programs. Click "EmergMkt" from the menu. This will copy "EmergMkt" into the expression memo box. You must now enter the user-defined variables (parameters) for this study, which are expressed as: EmergMkt(N,M). The number of days in the test period (N) and the number of days used to establish the closing market price for determining flatness (M) have been arbitrarily set at 20, and 3, respectively, in this example. The entry for our example was expressed as: EmergMkt(20,3). Capitalization must match! Any similar pairing will uncover similar emerging opportunities. The larger the input value of N and the smaller the value of M, the fewer will be the candidates to study. Since the study uses the first N days to establish a base period, and the last M days to determine if a breakout has occurred, the number of days of history previously selected must be at least N+1, and N must be at least twice M. Both must be non-zero values. Otherwise, the study will just return empty columns. If you would like to look at the Perl code for the study, click [Edit Library] at the bottom of the screen, and scroll down to where the study source is located. Click [OK] or [CANCEL] when finished reading the source code, and click [OK] again to begin analysis. EmergMkt immediately begins examining the trading range for all days during the base period and computes the standard deviation over that period for every OTC stock. The final closing price of any stock on the day following the base period is compared with the price of that stock on the final day of the base period. Each stock that rises or falls by more than the ratio of the price difference divided by the standard deviation receives a positive or negative Z-score. The Z-score is the number of standard deviations for any given breakout observed. Following a small computational delay, the EmergMkt study will highlight all of the stocks from the market list supplied which, for the last day on file, moved out of their flat trading range. The output display includes the day-before close, today's close and a Z-Score. Since we are only interested in stocks with moves greater than 3 standard deviations, we can shorten the list by filtering the selection by Z-score. Click the Z-score heading, then pull down the "Columns" menu and click "Filter By." The "Show only when" prompt allows you to select which Z-scores (sigma values) to keep. Leave the greater than (>) sign at its default presentation, and then enter 3 in the edit box. Click the "Absolute value" box to show both rising and falling markets. The reason for a 3 sigma setting is that it will reveal about 1% of the stocks or futures supplied. A four sigma setting would find even fewer possibilities. Out of the 9,000 NASDAQ stocks CSI follows each day, a 3 sigma filter setting will usually reduce your list of opportunities down to about 50 to 100 stocks that show up as emerging markets. Similarly, about the same number will show a precipitous drop each day of negative 3 or below. Any threshold is permitted, and the significance of the resulting list will heavily depend on the number of days loaded from the database and your Z-score threshold. After the
study is run, click on the spreadsheet's Z-score column to sort the stocks by
their respective scores. The larger the positive Z-score, the more significant
is the jump up in price between today and the base period. The smaller the
negative Z-score, the more significant is the drop in price, relative to the
base period. It will be up to the user to decide whether to focus on the rising
or the falling group, and whether the opportunity favors buying or selling.
In our experience here at CSI, we have used this tool to uncover previously unknown reverse stock splits that might have moved a security from say a "penny" category to perhaps a value that would qualify it for a NASDAQ listing. Exchange rules require stock valuations to fall within certain boundaries. In order to maintain an exchange presence, some stocks occasionally require reverse or forward split attention. There are significant dangers in trading on the results of a scanning exercise. Shortly before writing this article we saw Moore Benjamin, Inc. move from $20 per share to $25 per share, uncovering an emerging "buy" opportunity at $25 following a brief two-day pause. It then resumed its upward movement beyond $37 per share. This could have been a great opportunity for the buyer, assuming a trade with the trend, but it could have been costly for someone trading against the trend. Often stocks tend to give back such precipitous jumps, so care must be taken to protect yourself at all times. Once MarketScanner has finished calculating the EmergMkt results, feel free to re-sort the list by category. Simply click any column heading to sort by ascending or descending values based on name, CSI number, Z-scores or price levels. If you are interested in the new MarketScannerT, please go to our website at www.csidata.com and check for its availability as a "UA Software Update" (under Support). Installation by download is, however, only an option for customers with UA version 2.2.0 or later who went through the full UA installation procedure including ActivePerl. Once version 2.2.2 is installed, you can begin using this powerful, versatile screening and scanning tool on the stocks and commodities of your choice. Some of the Perl programming code is fully annotated, so user-defined modifications can be made with a full understanding of the original program. With or without modification, it is clear that UA's MarketScanner can significantly shorten the time one spends searching for opportunities, and Perl is a good choice for quickly customizing your own set of unique studies. Bob Pelletier
EmergMkt Troubleshooting: Because our example uses a 20-day base period for the study, it will only work if your "Include ___days" box on the Options screen was entered at 21 or more days of data. The number of days required may be obvious from the sample code supplied with the product. ActivePerlT and Microsoft®
script control, which were provided to all users on CD as part of UA version
2.2.0, are required for running EmergMkt. If you did not install these programs
and now wish to use EmergMkt, you should order a replacement CD-ROM from CSI.
See the CSI Product Summary on page 8 for pricing.
PAGE 1
|