Questions and Answers
Q.
Why are there missing days in some of my overseas price series?
A.
When viewing a given series with Unfair Advantage® (UA),
unexpected voids may appear for non-US markets as holidays occur around the
world. To find out if a holiday is affecting a particular data series, check
the "Events Calendar." From UA's main menu, select Database, and then click
"Facts and Events." Click on "Events Calendar" and scroll through the calendar
to find the date of the void.
You will find the holiday name and a list of countries that
honor the holiday. The CSI database maintains the holiday schedule for all 100
or so world markets from about 80 countries. Somewhere in the world a holiday
will occur on the average once every third trading day. Whether it is Vernal
Equinox Day in Japan, ANZAC Day in New Zealand, Buddha's Birthday in Korea, All
Soul's Day in Brazil, or the Hindu Festival of Lights in Malaysia, UA v. 2.3.3
and later will supply the date and details for your benefit in your trading
experience.
Q.
I upgraded to UA v 2.31, but have had a problem with my
analysis program since then. Has anything changed in the export specifications?
A.
You must be using SuperCharts® with the CSIM format. There
was an incompatibility problem in UA v. 2.31, which has now been corrected. You
can get around the problem by either requesting upgrade information from our
technical support staff or by using the MS format for your SuperCharts export
files.
Q.
I'm suddenly unable to find a particular stock in my
portfolio. It's a preferred stock that I've been following for over a year. I
know it still trades. What's up?
A.
We have standardized our symbols for preferred stocks, which
are now identified by more commonly used symbols. The symbols of all preferred
stocks now include a plus sign (+) character embedded within the symbol. If you
are unable to find a given preferred stock by its usual symbol, search for it
in the full UA stock database by name, and then add it back into your UA
portfolio.
Q.
Is decimalization complete at the US stock exchanges?
A.
As this Technical Journal goes to press, the NYSE has
completed its conversion by trading all 3,525 listed issues in decimals. NASDAQ
has successfully completed the first test on a pilot of 15 stocks. They expect
to test 150 additional securities on March 26th and convert the remainder of
NASDAQ equities on April 9, 2001. Unfair Advantage users will always receive
stock prices in whatever trading increments the exchanges use, and the software
will seamlessly handle the transition. We will convert decimalized prices to
fractions as necessary for continued compatibility with QuickTrieve.®
Q.
I am interested in UA's Trading System Performance
Evaluator,T but am unsure about getting and introducing an accurate list of
profits and losses. Where can I get such a list?
A.
Trading systems produce a tabular listing of every simulated
trade, complete with the net profit or loss for each. Check your trading
system's documentation to see if this is available. If so, either type or
import it into TSPE.
UA will produce such a listing for any custom indicator that
includes buy and sell signals, once the indicator has been displayed through
UA's charting module. You can view these statistics through the charting
module's right-click popup menu. Simply click "View System Performance," and
then click the "Trade-By-Trade" tab as shown.
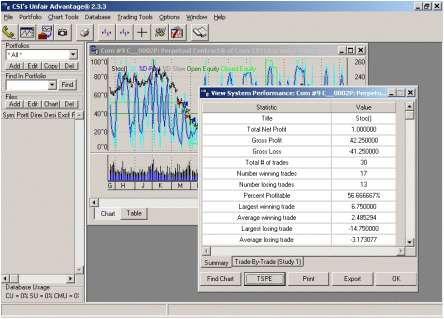
Click the [TSPE] button at the bottom of the screen to
automatically launch TSPE and load the P&L string. You may need to click
the TSPE icon on your Windows task bar to bring the program forward. You'll see
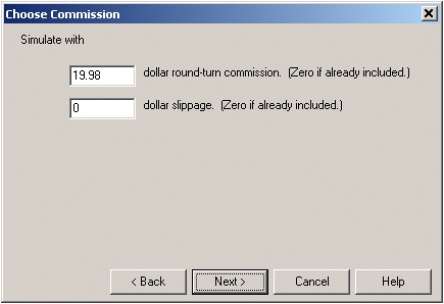
that TSPE has proceeded as if you are importing a P&L string. You'll be
asked to enter commission and slippage, and then to proceed normally.
If your UA doesn't support this feature, you can still import the
data into TSPE fairly easily. Just click the [Export] button at the bottom of
the trade-by-trade statistics screen to save the file to disk. Start TSPE
normally and import the file instead of typing profits and losses.
Q.
I'm trying to create a chart of the June, 2001 Swiss Franc contract
using the "New Chart" icon on the Unfair Advantage toolbar, but I can't get it
to work. First I click the "New Chart" icon, and then (after making sure the
Market Type is set for "Futures") I type the symbol (SF) into the "markets"
box. The "Raw" tab, which I would expect to list all the available contracts,
stays blank, so I press <Enter> to enter the stock symbol into UA. At
that, UA goes back to the main screen without producing a chart. All the other
tabs (back-adjusted, cash, Nth nearest, etc.) work fine. How can I create a
simple "Raw" using the "New Chart" icon?
A.
You are inadvertently sending UA into its "get chart" mode
before specifying which raw contract you wish to chart. Before pressing
<Enter> or clicking [OK], click the "Raw" tab from the selection screen,
even though it is already displayed. UA will produce a refreshed list of
available raw contracts for the symbol you just entered, from which you may
choose your desired contract. Click the contract you want and then click [OK]
or press<Enter>. Your selected contract will then be displayed in chart
form.
Q.
Are there any options for displaying data in my UA charts
other than a standard open-high-low-close bar chart?
A.
UA allows you to change the presentation of price bars with
a few simple clicks of your mouse. From any UA chart, right-click your mouse
and move to "Display Bars As" to display the following choices:
Close Only
- one dot per reporting interval;
High Low Close
- standard bar chart without opens;
Open High Low Close
- most detailed bar chart;
Candlestick
- charts present price data in a different form from a standard bar chart. To
produce a candlestick chart, we plot the daily range as a vertical bar. Open
and closing prices are plotted as dashes crossing the high/low bar. These
dashes are connected by vertical lines that create a box. The resulting
formation resembles a candlestick that burns from both ends. If the closing
price is higher than the open price, the box is empty. If the closing price is
lower than the open price, the box is shaded (solid).
Traders have developed colorful terms to describe candlestick
chart formations, including spinning tops, hanging man, dark cloud cover, etc.
These formations, alone and in combination with others, identify market posture
as bullish or bearish and give reversal signals.
If you received UA v. 2.3 or higher on a CD-ROM and are
experiencing any error messages or problems with the software, please contact
CSI Technical Support at (561) 392-8663 or techsupport@csidata.com. If
appropriate, they can give you instructions to download a patch to correct the
problem.
PAGE 2
|