| Monthly
Article
Topics for July |
||
|
This Issue
Various Topics
Tech Talk
Market Statistics
Notice:
Copyright (c) 2001 Commodity Systems Inc. (CSI). All rights are reserved.
|
Topics discussed in this month's journal.
Holiday Schedule CSI will be closed for voice communication on Wednesday, July 4th for the U.S. Independence Day holiday. Data from open markets will be available at the normal posting times, and the CSI host computer will remain accessible throughout the holiday.
If perception is reality, then the whole business of technical analysis is a quest for that which is real. It is an effort to quantify and categorize and get a physical grip on the elusive free market economy. Our perception of the markets is based on digital data telling us the highs and lows and points in between over the course of a minute, an hour, or a day. The data points tell of our victories and losses, of stop-outs and margin calls, of limit ups and limit downs. These values can all be written in stone, but still lies the question of which data are real. Do you require an online cybernet connection with a streaming flow of numbers to see the reality of the market at any moment? Are you content to view the quotes after the close for a daily reality check? And if you delve into analyzing that interday data, can you trust the actual values or must they be massaged and manipulated to present the real situation? Users of CSI's Unfair Advantage® software have many options for viewing data and for subsequent analysis. Here is a look at various ways we can change our perspectives, if not our perceptions and realities of the markets. The most detailed form of market information is a tick-by-tick data feed, but many would argue that it is not the best form of data for analysis. And make no mistake about it, tick-by-tick does not mean real time at the quotation terminal. All such data are historical in nature because of the many-second delay imposed before transactions can be viewed. Too much noise and too little substance; reality can't be distinguished from such small packages. Even a once-a-day update of open, high, low and close pricing can be considered too short-term for meaningful interpretation. It takes a string of days, weeks and months to get the big picture that is preferred by many technicians. For futures traders, getting a long-term perspective can be a daunting task. Each contract has such a limited lifespan, and an even shorter period of high liquidity. How can you catch and quantify and categorize this bit of information quickly enough? How can you know the truth about a contract and its interrelationship with correlated products during its brief moment in the sun? You can't.
What you can do is use pure, raw data to create a new perception that better
reflects reality. With Unfair Advantage, you can develop a data set that is low
on noise and high on substance. These "computed contracts" on related markets
can span decades, giving you a clear, long-term view of what really happened in
the markets over time. Although UA offers many different options for computed
contract formulation, they all present the disparate futures markets as
manageable creatures, each with a single beginning, middle and end. All of our
computed data series serve the purpose of giving futures traders a workable way
to view futures markets without the roadblocks of expiration dates. The trick
is in producing a series that adequately simulates the perils, profits and
pitfalls of actual trading.
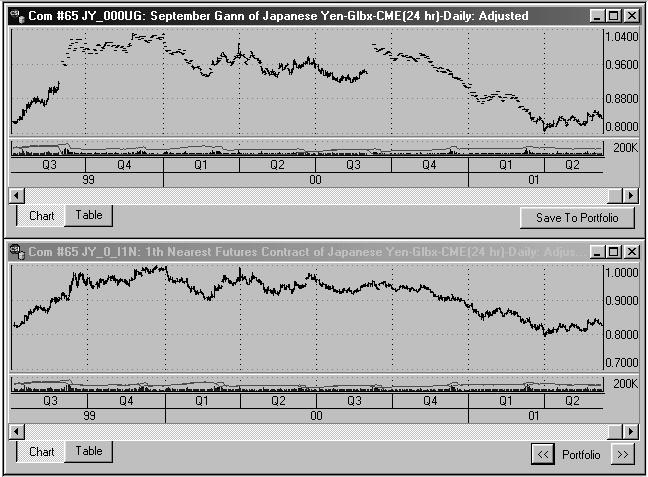
(Chart 1) Above are dual UA charts of Japanese Yen futures demonstrating a Gann file (upper chart of September contracts) and a 1st Nearest Future file (lower chart). In the Gann file, the illiquidity of the early portions of consecutive September contracts is evident from the sudden price gaps in the third quarter (after the current contract expires) and the narrow trading range from the end of the third quarter through the first quarter of each year. The nearest future series does not exhibit this characteristic because it focuses only on periods of high liquidity. It all started with Gann Gann contracts are probably the oldest form of manipulated futures pricing. They present a futures market as a concatenated series representing a single delivery month over a period of years. For example, a Gann time series might hold up to 12 months of the current September 2001 yen contract, preceded by the final year of the September 2000 yen contract, preceded by consecutive September yen contracts back to the beginning of trading. The Gann enthusiast, typically an astrologer, might select one delivery month, or might view the entire history of all delivery months, each as a separate continuous series. The Gann approach provides time series with few discontinuities. However, the one-year segments of a "Gann file" may be too long to yield meaningful information to a technician. What may have been learned from the distant (early) portion of each one-year segment of the time series may not reflect the reality that might be experienced in trading the contract as it approaches maturity. Each contract's volatility and trading volume gradually increase until a maximum level is reached near the end of each delivery month's contribution to the overall series. Unfortunately, the later period of each contract (which represents the time when trades would be taken) is likely to show no statistical resemblance to the relatively tame earlier period. Considering Liquidity It is important to recognize that nearby contracts (those about to expire) enjoy much heavier volume and open interest than contracts with later expiration dates. Farther out contracts are comparably illiquid, and subject to order-execution slippage, which can take a significant toll on both actual profits and efficient order execution. Technical traders are wary of entering far distant contracts, so liquidity factors relating to open interest and volume, life span and distance from expiration are important considerations in creating computed time series. The trader's perception is that trades are taken in liquid markets. Illiquid markets do not affect profits one way or the other because they are avoided. Although it is true that individual contacts have periods of low volume, the reality for most traders is that trades are taken only when volume is high. A data series that shows only high-volume portions of price activity is, therefore, a better presentation of the trader's reality. Of Near and Far The Nth Nearest Future series accomplishes the dual task of combining successive futures contracts into a single series and tracking prices for the liquid portion of each contract's life. Unfair Advantage creates these by splicing together a specific portion of successive delivery months into a series covering any number of years. They allow traders to simulate the practice of trading and viewing the more active (in some cases, the less active) periods of successive contracts to obtain a feel for trends, volatility and opportunity for profit. Many traders prefer viewing the markets from a nearest-contract-to-expiration perspective, but some may opt for less active, further distant contracts. An advantage to this approach is that it corresponds to the trader's reality while still representing actual market prices. A major disadvantage is that significant price jumps or drops (discontinuities) can occur from one contract to the next, which may discredit, distort and diminish analysis results. Perpetual Contract® Data The concept of Perpetual Contract data was developed to correct what I saw as a shortcoming of the popular nearest-future data. A Perpetual Contract data series is a time-weighted average price of the two active contracts whose expiration dates lie earlier and later than a date that is a fixed number of days ahead of the then-current date. This method of calculation provides an accurate view of the market's characteristic waveform over time that is "perpetual" in nature. It is similar to the forward contracts offered by the London Metals Exchange (LME) where the period forward is fixed. A drawback of the Perpetual Contract data approach is that the contracts cannot be traded directly, and can only be used as a guide for overall market direction. They are used to assist in examining longer-term analysis alternatives, but make no attempt to mimic the "real" market. The long-term picture they create, however, is much closer to the market's true nature than the disjointed picture created by a nearest-future series. The "Perpetual Contract" term and idea were invented by CSI about 25 years ago. At that time, we captured a service mark for the term and registered it with the Federal Trade Commission in Washington, D.C. We have consistently made reference to our intellectual property rights and our mark whenever they is used in interstate commerce, but this hasn't daunted some publishers and data vendors who have illegally "borrowed" our property rights for their own purposes without service mark reference.
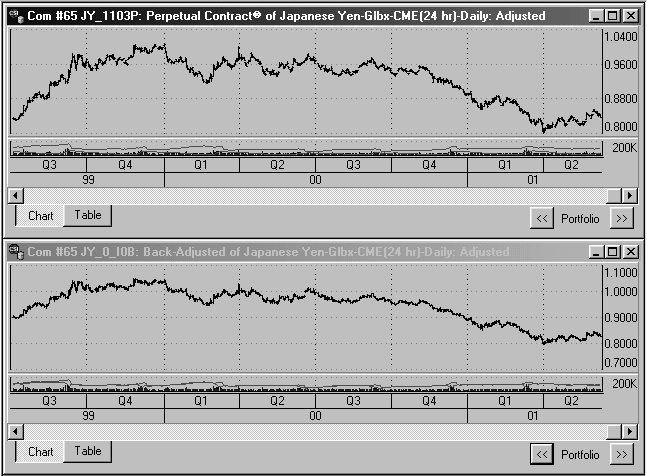
(Chart 2) The above UA chart of Japanese Yen futures demonstrates Perpetual Contract Data (upper chart) and a back-adjusted data file (lower chart). Both computed contracts focus on the high-volume period when traders would be in the market. The Perpetual Contract series uses a fixed period forward date for calculation. Back-adjusted series remove the gap between consecutive contracts by applying a delta value backward in history. Compare these series to the previous charts. Back-Adjusting Data By far, the computed contracts that get the most attention from our current customers are the back-adjusted series. Back-adjusted contracts use the actual prices of the current contract with a backward correction of consecutive earlier delivery months to eliminate price discontinuities between contracts. Because of the removal of contract-to-contract price jumps and drops in back-adjusted contracts, they appear as smooth, blended, homogeneous price histories representing a concatenated compilation of successive contracts over time. Perhaps the most appealing feature of Unfair Advantage's back-adjusting method is the variety of user-defined options available. The analyst who is seeking a unique trading method for optimal profits can further customize his or her results by formulating a unique set of input data. Among the user-defined options is the ability to set rolling preferences so that the series themselves will simulate trading situations when the trader would most likely be in the market. This allows the trader to avoid viewing those periods when there is either a risk of delivery or an exposure to highly volatile markets. Therefore, these series come very close to the trader's own reality of the markets. UA permits additional customization of these series to further enhance this perception. For example, UA allows the user to set the selection method of representative prices. This heavily impacts the way the gap between adjacent contracts is identified. The option of comparing the open price of the new lead contract with the previous day's close price of the former lead contract is an especially desirable feature because it gives the user the opportunity to either ignore or include a real gap in contract-to-contract price movement. No data series is perfect, and even adjusted series have their drawbacks. Both forward- and back-adjusted contracts tend to produce a long-side inflationary bias, where the act of buying is more favorable than the act of selling. UA's detrending option can reduce this effect, however. Forward-adjusted series can easily present negative values for the current price. Now that's a little hard to justify as reality, even in simulation! The Volatility Factor It should be recognized that statistical stationarity is important in any analytical input series. This is particularly true when there is a sufficiently long period from birth to death to change the contract's volatility over time. Stationarity exists when the mean and variance (volatility) of a serially correlated series remains statistically constant over time. Stationarity can best be found in computed Perpetual Contract data series. For some, volatility is a more important component of market analysis than price or volume. One user recently expressed an interest in viewing the percentage volatility of a back-adjusted series over time as the ratio of the computed market volatility to the average actual input contract price. Unfortunately, this cannot be easily provided, but we are looking into sacrificing one of the four volume or open interest fields to provide the closing prices of the raw contracts from which the back-adjusted series was derived. We may offer more on this idea in future Journal articles. Whether you
view the markets through raw pricing, computed contracts or volatility values,
the data you rely upon represent your reality. In your own quest to quantify,
categorize and get a grip on the markets, it is important to know that your
database is accurate and your methods of manipulation are consistent. In our
daily quest to deliver a true record to our customers, we hope that the
perceptions provided through our products and services help you shape a
successful reality in the markets.
Latest version of our standard back adjuster software All current UA subscribers may visit our website or contact CSI technical support to receive the latest version of our standard back adjuster software (adjust.exe). The free patch is available for download and should be stored in your UA directory for optimal results. CSI's standard back adjuster is
compiled by viewing the market backward in time. CSI's alternate back adjuster
is compiled by viewing the market forward in time. Do not expect the resulting
time series to be equivalent. The directional viewing perspective forces the
reality of these two approaches to be significantly different. Please see the
Unfair Advantage manual for more information on the various computed contracts.
PAGE 1
|