

[Click here to return to journal index]
© Copyright 2003 by Commodity Systems Inc. (CSI). All rights are reserved.
Website Links: This CSI website and Unfair Advantage system contain hyperlinks and automatic links to websites operated by parties other than CSI. No association with or endorsement of third-party websites should be inferred through these links. They are provided for your convenience and reference only. CSI is not responsible for and has no control over the content of third-party websites.
|
December 2003
CSI Technical Journal Volume XXI, Number 12 |
Page 1 |
Topics discussed in this month's journal:
Holiday Schedule
CSI will be closed for voice communication from Wednesday, December 24 at 6 p.m. through Thursday, December 25, and from Wednesday, December 31 at 6 p.m. through Thursday, January 1 for the Christmas and New Years holidays, respectively. The CSI host computer will be accessible without interruption throughout the holidays and data will be available for any market that remains open on these days. The CSI staff sends you, our valued friends and patrons, our very best wishes for the season and the coming new year!
An Unfair Advantage® Guided Tour
Charting, technical analysis, account evaluations, daily updates and intraday updates. These are but a few of the services offered through CSIs Unfair Advantage (UA) software. If you arent using your UA to its full potential, youre cheating yourself. Its easy to use Unfair Advantages robust capabilities, but sometimes a little nudge or a guiding hand is needed to begin the process. With that in mind, we invite you to explore a few UA features with the Technical Journal editorial staff. If you have a current version of Unfair Advantage on your computer, please consider booting it up and following along in this quick tour and tutorial.
Building a Portfolio the Quick & Easy Way
Lets say youre a spread trader with positions in multiple commodity markets: March and May corn, March and May soybeans, and February and April gold, for example. Follow these simple steps to create such a portfolio:
1) Click UAs Portfolio Menu and then click Create New Portfolio. Type a portfolio name, such as, MyFutures and click [OK]. Unfair Advantage will proceed to the market selection screen.
2) At the Selecting Data Series screen, make sure the Market Type says Futures. In the Symbols box to the right of market type, enter the symbols for each of these commodities. For our example, the input would be C, S, GC. (If you prefer to use CSI numbers, go ahead and enter them as 9, 17, 30.) Or, if you dont know either, you can choose from a list by clicking the [Mkts] button next to the Symbols box.
3) Since the delivery months you trade are fairly nearby, it would be easy to view them as part of an Individual Futures Group (IFG). Simply click the IFG tab in the center section of the screen where contract types are selected. Click [OK] to accept that the nearest three contracts will be included for each of your markets. (This will encompass the required contracts, plus a few more.)
4) If youll be analyzing this data with another software program when youre finished with UA, chances are good that youll need to export the files into ASCII, Excel, CSI or MS format. Youll see the choices at the right side of the data selection screen. Check all desired formats by clicking the appropriate boxes.
Click [OK] and your quick-and-easy portfolio will be created, with the contents listed in the Portfolio Manager panel.

Daily Updates
Unfair Advantage maintains its massive database through daily updates that are retrieved directly from CSI via the Internet. These summary quotes are available shortly after each respective market closes, so you may make multiple downloads over the course of the day.
To begin, click the Download icon (first on the toolbar, shown above). The Download/ Distribution Selection screen displays:
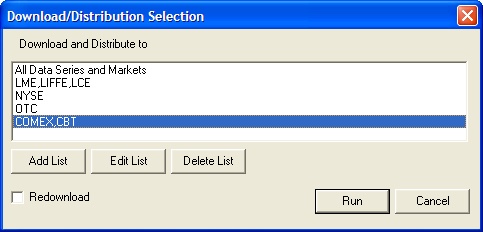
This screen gives you the opportunity to proceed with collection and distribution of all available markets or to fine-tune the selection to just those of interest to you right now. It was recently added to Unfair Advantage to maximize efficiency and minimize distribution time. All of the contracts in our sample portfolio are found on just two exchanges, COMEX and the CBT. These have been added as a single list, which we can select here. Click [Run] to download and distribute your choice of markets.
SnapQuote Intraday Updates
If you would like your daily Unfair Advantage charts to be updated with intraday prices, you can arrange it through the new SnapQuote (SQ) feature. The Portfolio Manager now includes selection boxes to record your preference for the SnapQuote intraday update service. View and edit this selection by expanding the Portfolio Panel to fill the screen. (Click the tiny right arrow on the divider bar.)
Below is a look at UAs updated toolbar (the new SnapQuote icon is second from the left) and an expanded Portfolio Manager. Note the new selection boxes for requesting Intraday Updates at the far right. You may identify the markets you want to update with SnapQuote by either selecting them from your portfolio as shown here, or by charting them.
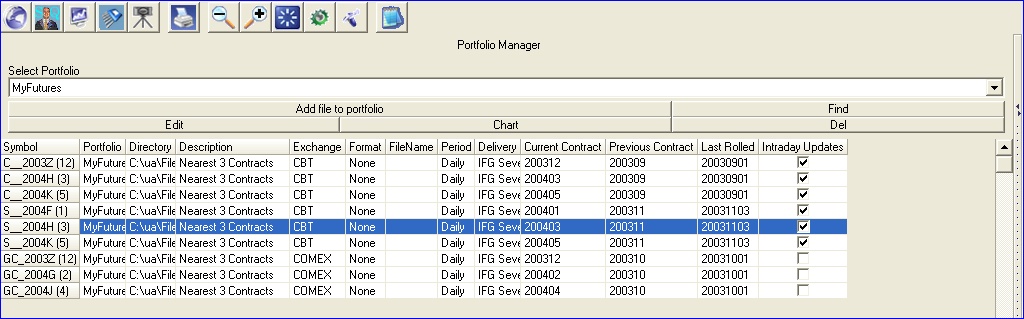
Once the desired markets are selected, clicking the SQ button on the toolbar will allow UA to seek out a recent intraday quote for each selected item from third-party website sources. These intraday quotes will be written to your UA database as current-day estimates. In this case, todays price bar will reflect the open, high (so far), low (so far) and a recent intraday price. These estimates will be overwritten with the official daily open, high, low and settlement when you access the CSI database for your normal daily update after the close. Only the official quotes will be saved in your database for each day.
Importing a Watch List into Position Manager
Lets say you want to check your account balances and position valuations for everything in your new portfolio. No problem! Its this easy to load your portfolio list into Position Manager:
Click UAs Trading Tools menu and then click Position Manager. When Position Manager displays, click the File menu and then Import Trades. Finally, choose UA Portfolio. The entire contents of your currently selected portfolio will be added to the Position List as shown below.
From there, you may enter additional information such as the purchase date, quantity of contracts, commission, etc. Now you can track current equity for each of your holdings and for your entire portfolio. Later on, you can edit the position list to show that you have closed out your positions. Position Manager will retain your trade records and keep track of your open and closed account equity separately.
To view intraday updates on the Position Manager screen, click Settings above the table of data and make sure that Update with Internet Prices is checked. This will keep delayed prices coming into your computer throughout the trading day with quotes from third-party websites.

Charting From Your Portfolio
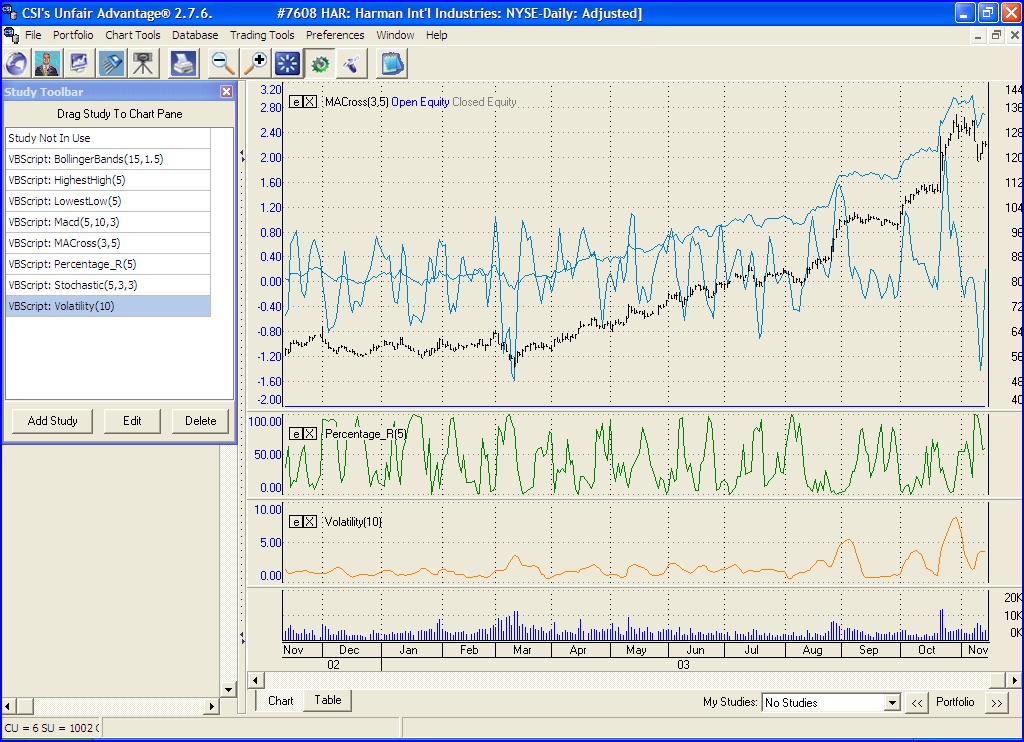
To see an Unfair Advantage chart of anything in your portfolio, just select it by clicking it in the Portfolio Manager Panel, and then click the [Chart] button above the portfolio list. Its easy to view all of your contracts by starting with the first one on the list and then clicking the right Portfolio arrow below the chart. You can scroll through your entire portfolio this way.


To add studies to your chart, click the Change Indicators on Chart button on the toolbar. A list of studies displays in the newly redesigned Study toolbar. This menu lets you select any of the displayed studies and simply drag them, one-by-one directly onto your chart. If you like, you can place studies in separate windows of the charting screen by dragging them into unused areas. If the study you want to perform isnt on the menu, click [Add Study], which brings you to UAs familiar Interpreted Studies. There you can select from a larger list or program your own analysis. Whatever study you end up with can be added to this list for future use.
Scanning and Screening
Nearly everyone has some stock market exposure, either through individual holdings or through pension or retirement funds, so lets consider expanding our market research into the stock and mutual fund markets using MarketScanner. Of course, analyzing stocks requires that you have subscribed to this market category from CSI. MarketScanner can also scan and filter futures markets, so you can use this utility even if your update service is limited to commodities. UAs MarketScanner provides innovative ways to screen for desirable attributes, be they fundamental data or technical analysis results.
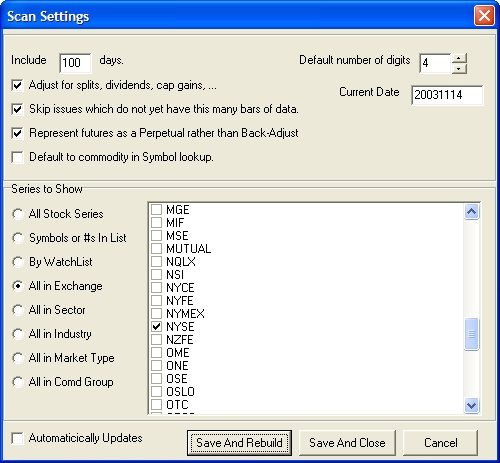
Here is an example of how we might discover which NYSE stocks have the highest earnings per share, the lowest price/earnings ratio and the greatest technical strength. It requires that we first launch the scanner and load the NYSE data as follows:
Click UAs Trading Tools menu, and from there, select MarketScanner. The Scan Settings screen displays, where youll select All in Exchange, and then scroll down the exchange list to NYSE. Click the box to check it, and then click [Save and Rebuild] as shown above.
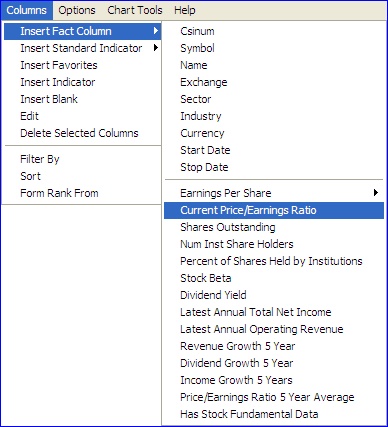
After a few moments compiling data, MarketScanner will display a list of all NYSE stocks. Click the Columns menu, and then click Insert Fact Column. Scroll through the list of available facts until you find Earnings per share and click it. A new column of earnings will be added to the MarketScanner spreadsheet. Lets say we want to include only those stocks whose earnings are $1 per share or more, so we click the Columns heading again and then click Filter. Edit the Filter by parameters to say greater than (>) 1.0. Instantly, the list of stocks is reduced to only those with earnings of more than $1/share.
Next add another column of Price/Earnings Ratios, and this time filter by a maximum P/E value. Well use 10 for our example. The Filter by parameters should appear as < 10. The list of stocks displayed in MarketScanner will be further reduced to only those with a P/E less than ten. Some series will show zero values, which can complicate your results. You can eliminate these from the list by requesting a filter requiring that all returned values be greater than (>) zero.
To add a technical aspect to our stock search, well use the Moving Average Convergence Divergence (MACD) study. This is also done through the Columns menu, but this time we must select Insert Standard Indicator. Select MACD from the list. When the MACD results are added to the spreadsheet, you can examine the results and decide what should be the cutoff for the filter. For our purposes, well keep everything with a value over .5. The final report is a list of just six NYSE stocks (see below).
This exercise used an arbitrary set of parameters and thresholds for demonstration purposes. They revealed stocks that have performed well in the short term, but they also excluded many well performing stocks. We are not recommending this or any other sequences of scan and filter settings, but invite you to investigate the possibilities yourself. Whatever your findings, please remember that past performance is no guarantee of future results.

These are a few of the quick, easy and exciting ways you can use Unfair Advantage to fill a broad range of market analysis needs. Theres more where this came from, so please feel free to continue the tour on your own. Consult the printed manual or UAs online manual (recently updated) for more details and examples. Also feel free to contact our Technical Support staff any time you have a question or need assistance.

Bob Pelletier
###
Tech Talk
Each month in this column, the CSI technical support staff addresses issues that may be of interest to many subscribers through this question-and-answer forum. This month they discuss the average volume data provided within the Unfair Advantage factsheets and unattended data retrieval.
Q. In looking though the Unfair Advantage commodity factsheets, I notice an Average Total Volume field. Exactly what does this represent and why is it included in market facts?
A. The average total volume is the mean daily total volume for the given commodity over the last month before your Unfair Advantage CD was produced. This information is provided as a general guide to market liquidity and for comparative purposes when choosing markets. For example, if you want to trade wheat in the most liquid market, you can compare the average total volume for each of the wheat markets listed and make an informed choice.
We dont regularly update this data on the factsheets because doing so would cause significant delays and because it is not necessary for this purpose. The minor fluctuations in average volume have little, if any, impact on relative rankings of market liquidity. Of course, UAs aggregate file processing will allow you to see updated weekly and monthly volume data for any commodity you choose, displayed as either the average, total or last volume figure available. The average total volumes in your factsheet files are updated with each Unfair Advantage upgrade.
Q. The Autoschedule feature of my Unfair Advantage is set to download at 9 p.m. so that it can retrieve updates and process my extensive portfolios and market scans at night. My computer is turned on, with Unfair Advantage running when I leave the office, but when I return in the morning, the computer is not running and the database is not updated. Why isnt this working?
A. It seems that your computer starts hibernating (an energy-saving automatic shut-down) after you leave the office. There is no way that UAs update instructions can be carried out when the computer is incapacitated in this way.
You can avoid the hibernation mode through the Control Panels Power Options, which are reached through your computers Start menu. To totally avoid any possibility of hibernation, set each turn off and standby time as Never. If you know how long it takes UA to complete your tasks, you might arrange for the hibernation to kick in after the work is finished. For example, if you leave at 6 p.m. and want the download to occur at 9 p.m., you should add the processing time (maybe an hour or more) to the three hour time lag. It may be that having your computer hibernate after five hours would allow UA to accomplish the desired unattended data processing and still let you experience some energy savings.
A superior method for managing an unattended retrieval session involves using Microsofts Scheduler. This procedure is typically used to produce data files in ASCII, MS, CSI/CSIM or Excel format, which are then accessed by a third-party analysis program.
The first step in arranging for fully automated updates is to place the file called "initiateUADownload.vbs" on the list of scheduled tasks. If the autoscheduler icon is in your program tray at the edge of your screen, double-click it. If it isnt there, find it on your Control Panel and double-click. A wizard displays, giving you the opportunity to identify a file to automatically run. Click the Browse button and navigate to the UA folder, where youll click the filename "initiateUADownload." (It may or may not have a .vbs extension on your screen.) Next youll be able to fine tune the accessing frequency as Daily on Weekdays, and set the desired time of the update. Click [Finish] to complete the scheduling.
Either method for unattended retrieval could be unsuccessful under rare circumstances when a CSI server experiences an unexpected hardware failure.
800-274-4727 | 561-392-8663 | 561-392-1379 (Fax)