

[Click here to return to journal index]
© Copyright 2003-2004 by Commodity Systems Inc. (CSI). All rights are reserved.
Website Links: This CSI website and Unfair Advantage system contain hyperlinks and automatic links to websites operated by parties other than CSI. No association with or endorsement of third-party websites should be inferred through these links. They are provided for your convenience and reference only. CSI is not responsible for and has no control over the content of third-party websites.
|
January 2004
CSI Technical Journal Volume XXII, Number 1 |
Page 1 |
Topics discussed in this month's journal:
Happy New Year!
Extracting Knowledge From Data
"Facts do not cease to exist because they are ignored."
Aldous Huxley, 1927
It's a new year; a time of promise when all things seem possible. I think it's a good time to review the previous year's successes and failures, and to set goals for future accomplishments. Here at CSI, these ponderings naturally lead to discussions about innovative investment strategies and ways to help our subscribers be successful as traders. Trading success requires more than capital and guts. It requires more than software and data. The successful trader takes the necessary steps to extract knowledge from data, and that makes all the difference.
In the past year I have spent many hundreds of hours in software development, creating and testing new methods of market analysis. Progress continues at a satisfying pace, with more and more attention being paid to discovering key input data for optimal results. As my staff and I move through this process, we often find ourselves inspired by the venerable CSI database and the analytical benefits it offers. The enormous scope of stock, fund, futures, foreign exchange, cash price and fundamental data supplied through the Unfair Advantage platform, much of which spans many decades, is truly phenomenal.
I consider it a minor failing on our part that so many of our subscribers eschew the immense database provided through Unfair Advantage® (UA) in favor of short-term analysis on a few markets. The UA database is a collection of irrefutable facts that can teach us all there is to know about the broadly interconnected world markets. It holds very nearly every pertinent fact about the markets that has ever existed. This being the case, why is it so often ignored?
As the British essayist Aldous Huxley brilliantly observed, "Facts do not cease to exist because they are ignored." The UA database's facts are an unmitigated source of knowledge, waiting to be extracted by the analyst who takes time to investigate. Although the knowledge-building facts are invisible to those who will not look, they still exist, influencing profits and lives in unknown ways. The UA database allows the diligent student of the markets to extract the knowledge that is critical to the development of a dynamic and insightful trading system.
We believe that a reasonable starting point for all analysis is an in-depth exploration of the inventory of products available for trading. The CSI database includes stocks, indexes, funds, etc., and covers nearly 100 worldwide futures exchanges, representing nearly 1,000 futures markets, ranging from famously popular stock indexes to arcane products like Japanese dried cocoons. Quotations include the daily summary prices for each product on a cash and/or futures basis.
Since this database is not restricted to U.S. futures and stocks, the user can explore intermarket opportunities within and between stocks, futures, cash, fundamental and forward markets from around the globe. Your pursuit of profits can circumnavigate the earth while you enjoy the comfort of your own home or office. Additional international capabilities will soon be added, as efforts are underway to capture stocks and additional futures from European markets. These will further expand upon our newly broadened coverage that includes almost all U.K. stocks from the London Stock Exchange.
We have long known, and our analysis confirms, that most commodity products and a great number of stocks are tied together in a cause-and-effect web that influences each and every element in a time-dependent serial relationship. Our studies under development seek to analyze and understand this complex interaction. We have made it a goal for 2004 to encourage our users to expand their scope of analysis, which we believe will lead to greater understanding of domestic and worldwide markets.
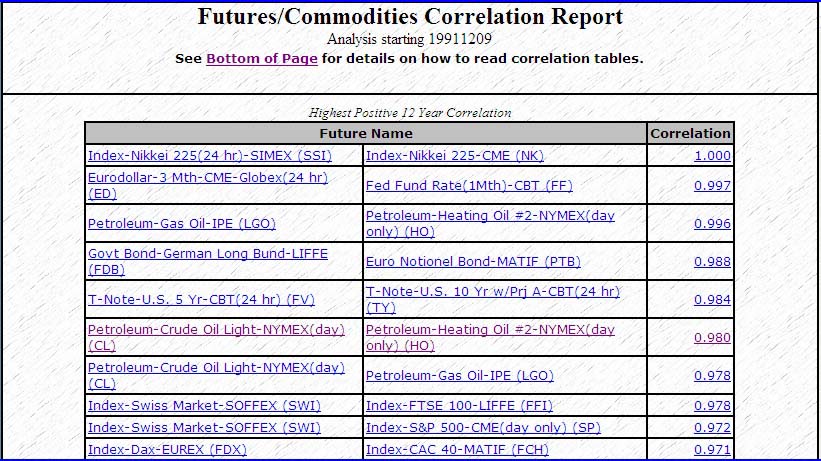
We recommend reviewing the wealth of intermarket information found in the wonderful correlation studies on the csidata.com website. These correlation tables compare all world commodity products with all other world products in a matrix showing correlation consistency over a period of 10, 20, 30 or up-to 40 years (currently back to 1972). CSI subscribers can access this information from the online newspaper section of the CSI website. To reach this data, choose "View Tomorrow's Newspaper" and then click the [Correlation] button under "Commodities" in the left margin of your screen. The correlation tables will help you to see that markets undoubtedly interact with one another, even though you may not necessarily understand why. A simple review of the correlation tables can keep you informed about these relationships.
CSI subscribers can see not only how related products move with respect to each other, but also how seemingly unrelated products respond to each other or to their common environment. You may be surprised at the markets that move consistently in step with or in opposition to each other. For example, Canadian Barley's price movement seems inexorably related to the movement of major U.S. stock market indices. Whenever the stock market goes up, Barley seems to respond with a major move upward and vice versa. Many commodities move together in a highly correlated manner such as this.
Another correlation study will reveal that the Canadian Dollar has been negatively correlated with the U.S. live cattle market over the last several decades. The casual observer might dismiss such a relationship as either an accident or even total nonsense, but if you look a little deeper into that situation, you will easily see why such a relationship makes perfect sense.
When the Canadian dollar is cheap relative to the U.S. dollar, importers of Canadian goods may find opportunities for arbitrage profits. Canadians sell more of their beef to Americans when the exchange rate for the Canadian dollar makes high quality Canadian beef an attractive alternative to U.S. beef products. Such a transaction could offer the purchaser a substantial discount for the Canadian beef product.
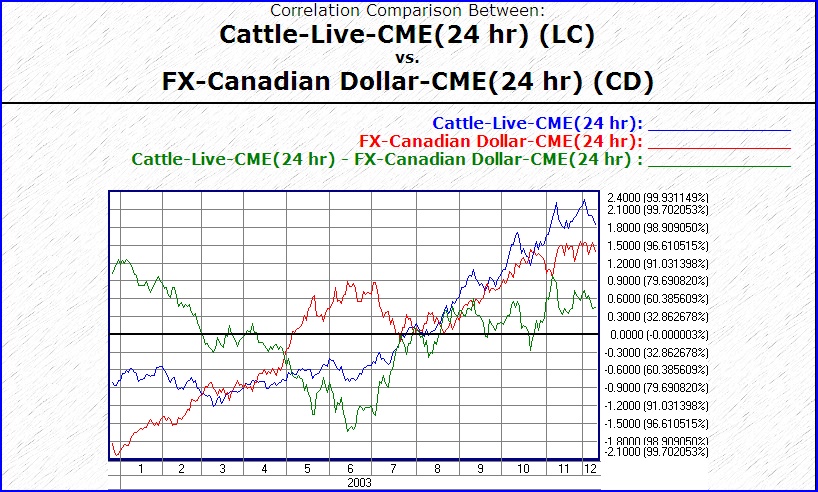
The above chart offers a preview of the relationship between Canadian Dollar and CME Live Cattle for just one year. Historically, the inverse relationship has been consistent for over 30 years. Not shown is the highly correlated relationship of Live Cattle to Feeder Cattle, which trade in a nearly lock-step pattern.
Energy markets, which are known to lead or drive the economy for most products, are another illustration of commodities that cry out for intermarket trades. There are many ways in which substitutability comes into play, so when energy costs are low, alternative tradeoffs abound. For example, aluminum is often traded off with steel, electricity, or energy costs because of the simple fact that 95% of the costs associated with aluminum production come from the cost of electrical power. These are but a sampling of the many alternatives available to the trader who may be looking to predict future market price movements by looking beyond the obvious.
A quick look at the CSI website's correlation tables reveals the relationships between product pairs: crude oil vs. heating oil; Kansas City wheat vs. Minneapolis wheat; the Swiss SOFFEX vs. the FTSE 100 on LIFFE; U.S. T. bonds vs. U.S. T. notes, etc., etc. There are literally many hundreds of market pairs, all of which await your investigation, some of which hold great opportunities for profit. The website interface gives no trading signals, but leaves it entirely to the user to identify opportunities where one might profit from short term leads and lags of one product versus another. There are many analytical methods which one might consider to make a highly correlated relationship work for your trading benefit over time.
It isn't just highly correlated markets that will make an analysis effort with Unfair Advantage worthwhile. Information from CSI's options data statistics, the unique contributions available from Steve Briese's Commitments of Trader (C.O.T.) data, very helpful information on seasonal patterns, and the influences of volume and open interest on trading activity all combine and contribute positively to a verifiable end result. With daily data series available back to the 1940s, the UA customer can depend on substantial resources to enhance many opportunities for fruitful discovery. Through an O.L.E. interface connected to Unfair Advantage, we have linked to a powerful programming product that allows for on-line testing and development.
Although we are working on software that will use the CSI database to develop trading signals, our primary function and the lifeblood of our business is and will always be building, maintaining and promoting the world's most complete and accurate financial database. Several well-regarded companies produce CSI-compatible software programs and do similar or related types of analysis in unique and innovative ways. We commend the developers for their dedication in bringing meaningful market analysis to investors. These software developers make it possible for traders to gain knowledge from the facts at hand.
Several very large commercial firms and trading companies make exclusive use of CSI data reserves to drive their businesses. Some firms typically capture not only world market data on CSI's futures markets, but they also use our options data for their work because they believe it is helpful to confirm changes in directional movement. Others find the depth and scope of our products to be helpful in trading their own accounts. Foreign exchange companies use CSI as their only reliable source of FOREX data, and customers regularly praise our commitment to accuracy and unexpurgated coverage.
There are, indeed, a good many facts in the CSI database that exist whether you ignore them or not. We leave it to you to decide if you will mine these facts to extract knowledge, which is, of course, power. We hope that you will take the opportunity of the new year to seek out and profit from new ways to learn from the past through the exploration of historical data. Experience the power!

Bob Pelletier
###
Tech Talk
Each month in this column the CSI Technical Support Staff addresses topics of interest to many subscribers in a question-and-answer format. This month they consulted with the CSI Database Staff to produce a database-oriented column that specifically focuses on Foreign Exchange.
Q. Some of the foreign currencies I follow are calculated using the opposite perspective from what I would prefer. For example, I want to know how many U.S. dollars can be exchanged per Canadian dollar, but CSI quotes Canadian dollars per U.S. dollar. Is there a way to change this?
A. We have recently adjusted our reporting protocol for foreign exchange cash prices such that all quotations use a denominator of U.S. dollars. I.e., Yen per dollar, Euros per dollar, etc. However, UA's "Invert" feature will do exactly the conversion you desire. The inversion process involves taking the reciprocal of the supplied data. If, for example, the CSI reported price is 1.3055 Canadian dollars for every U.S. dollar, then the inverted value (the reciprocal) in this case would be 1/1.3055 or .7660. Of course, this calculation requires that the high and low be switched, which UA handles automatically.
You can apply the inversion to UA charts for graphic review or to export files for use in third-party analysis programs. The "Invert" selection is found on the "Selecting Data Series" screen that is used for both chart creation and adding files to a portfolio. Simply click the "Invert" check-box in the lower right corner of the screen. This is a market-specific feature that should be applied only to those few FOREX markets you wish to invert.
Unfair Advantage's factsheet conventions are at odds with what many FOREX traders have come to expect because FOREX transactions are typically reported using confusing nomenclature. For reasons we don't pretend to understand, FOREX trades are quoted with the base unit (the apparent denominator) on the top of the ratio, giving an inverted result. For example, if there are 119.72 Yen per dollar, a bank would report the FOREX trade as USD/JPY=119.72. The mathematically correct presentation of this would be JPY/USD = 119.72. Recognizing the need to be in step with our customers' needs, we are changing our factsheets to match user expectations. The name field will therefore show the correct algebraic relationship, and the UNITS column will show the FOREX convention by inverting the algebraic ratio. The FOREX exchange rate for the above example would still show a price of 119.72 Yen per dollar.
Q. Where does CSI get its CASH FOREX data?
A. There is no centralized exchange for cash foreign exchange markets. Therefore, CSI gets the data from major banks. We use several different banks in order to cover as many currencies as possible. The roster of banks used for FOREX quotes has changed over time and is subject to change in the future.
Q. With CASH FOREX data coming from individual banks, how representative of worldwide markets are the quotes?
A. Good question! Although the currency departments in the banking world are arbitraged by some large traders, it is still possible that the quote we get from one bank may not reflect heavy trading at another bank. This limitation is inherent in any market for which there is no centralized exchange, and is, in no way, unique to the CSI database. It is, however, reason to recognize that FOREX CASH data is always localized and subject to fluctuations across world markets.
The exchange rate quoted by your local bank usually incorporates both a fee and a future premium. For example, if the bank can trade Euros for U.S. Dollars with an exchange rate of 1.20 Dollars to the Euro, they might quote you 1.30 if you want to buy Euros with Dollars and 1.10 to buy Dollars with Euros. This provides a fee for aggregating many small orders into one large wire transfer, and also insulates the bank from the exchange rate fluctuations between when they take your order and when they process the aggregate order. To further complicate things, the bank's mark-up is usually less for larger orders to cover their fixed per-transaction costs, so it is hard to compare your bank's rate with the CSI data.
Q. I notice that sometimes my FOREX CASH data seems to represent an open, high, low and close, while other times there are just two prices across the four price fields, with the open equal to the high and the close equal to the low. Please explain.
A. This can happen when there was very little (possibly only 1) FOREX trading in the given currency at that bank for that day.
Q. What time period is represented in a daily quote for FOREX CASH data?
A. It's a nearly day-long period spanning from 5 p.m. (New York time) until around 4:30 p.m. (New York time) the following day.
800-274-4727 | 561-392-8663 | 561-392-1379 (Fax)