

[Click here to return to journal index]
© Copyright 2003-2004 by Commodity Systems Inc. (CSI). All rights are reserved.
Website Links: This CSI website and Unfair Advantage system contain hyperlinks and automatic links to websites operated by parties other than CSI. No association with or endorsement of third-party websites should be inferred through these links. They are provided for your convenience and reference only. CSI is not responsible for and has no control over the content of third-party websites.
|
February 2004
CSI Technical Journal Volume XXII, Number 2 |
Page 1 |
Topics discussed in this month's journal:
| E-Mail Notice --
Subject is required. Due to the proliferation of spam e-mails that arrive without a subject heading, our server will no longer accept messages with no entry in the subject line. Your e-mails are important to us and we dont want to miss a single one, so please be sure to enter a subject for any e-mail correspondence to CSI. Thank you. |
How Knowledge and a Depth of Intermarket Data Can Translate Into Profits
When CSI was incorporated back in 1970, there were fewer than 20 viable commodity markets that allowed investors to lock in prices for future products. Futures trading, as it came to be known, was unfamiliar to the general public. In those days the Coffee, Cocoa, and Sugar Exchange was going strong and the Chicago Board of Trade (CBT) was in its infancy. Traders could dabble in Maine Potatoes and Eggs, now defunct markets that were put out of business largely because perishable and non-storable products do not fare well in futures trading. The Winnipeg Grain Exchange, the Kansas City Board of Trade and the Minneapolis Grain Exchange offered some competition for the CBT, but the Chicago Mercantile Exchange didnt exist and there was little else from which the commodity speculator could choose.
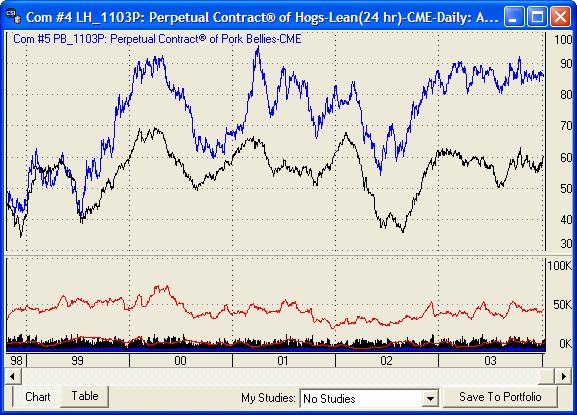
| Live Hogs vs. World Markets: This Unfair Advantage chart shows the moderate correlation between the CME's Live Hogs and Pork Bellies futures. Live Hogs can also be seen to correlate with CBT Corn (a traditional feed for hogs), Orange Juice, Soybean Meal and London Wheat, all of which should be consulted before taking on any given Live Hog position. |
In this chart, it appears that there is an interesting tendency for Live Hogs (the lower series) to lead Pork Bellies (the upper series).According to the correlation tables shown on our website, the two series are correlated at the 46% level. Since this pair of markets exhibits a moderate and consistent level of positive correlation, it should be reasonably productive and profitable to depend upon the correlation tendencies for this market pair. Both pork bellies and live hogs were paired using three-month forward Perpetual Contract data for each series.
Today, with over 800 world commodities and financial futures products worldwide, the investor or analyst has many opportunities to explore through CSIs inventory of tradable products. Each new market in the futures mix exponentially increases the supply of opportunities available to the investor.
If you have been regularly watching this Journal, which has been published monthly for over 25 years, you have undoubtedly read that some markets are sufficiently correlated to move together in tandem. In our view, there is no better way to earn a safe return from the futures markets than by following markets that are related and dependent upon each other. The leadership tendencies of one market relative to another related and interdependent market may lend a helping hand in forecasting the other markets movement. The savvy trader can solidly benefit from the directional movement of these markets through arbitrage, or something like it.

| This graph from the Commodity Correlation portion of the CSI website was compiled from twelve years of daily pricing statistics on the Nikkei Index and the U.S. Ten-Year T-Note. This chart displays the two series and a graph of their difference. The two series are each scaled by subtracting the whole-chart mean and dividing by the whole-chart standard deviation to get their Z-scores, which are presented graphically. The difference of these Z-scores is also shown. The scale on the right includes both Z-score and the implied normal probability. The CSI website offers charts using the most recent 12, 20, 30 or 40 years of daily pricing behavior to statistically correlate the behavior of some 640,000 futures market pairs. |
Arbitrage is defined as the act of buying something in one market and selling a very similar product in another market. This is often done in the currency arenas and in equity markets when a stock is bought in one market with equivalent shares sold in another. A parallel investment strategy - sort of value-oriented arbitrage, if you will, involves buying something in one place that is offset by the sale of a related thing in a different venue. Consider the applications for commodity traders who extend the practice to futures markets that are related by time or utility.
As more and more commodities have been introduced into the world economy, traders have increasingly experimented with ways they might trade one market off against another, or trade a market based upon its tendency to lead another. The CSI database is so extensive that the more markets you investigate, the more opportunities youll find for this sort of arbitrage-like commodity trading.
Even so, most futures market speculators concentrate on only one or two markets. They have adopted the strategy of buying one thing they clearly dont want and regularly selling what they dont have. These speculators try to sense the tone and tempo of the market before launching each trade.
We have come a long way since 1970, when virtually the only game in town in terms of trading systems was the point-and-figure chart, a largely discarded technique, but we still have a long way to go. When will average traders regularly make the bold step of cross-market trades for superior and safer returns on their investments?
We discussed Live Cattle in last months CSI Technical Journal as an excellent candidate for intermarket trading opportunities. With Mad Cow Disease in the news recently, that market has suffered. The unfortunate illness of that single cow demonstrated for us all the inherent volatility in any futures market. Drought, war, energy crises, fuel gluts and disease (or the threat of it) can send these markets into a tailspin on a dime. But they recover.
I have no doubt that U.S. beef will continue to be a viable investment vehicle. Beef products are such an important part of the worlds food supply that there is little likelihood that the Live Cattle market will be wholly abandoned.
Live Cattle regularly moves in tandem with feeder cattle. Both products are the same except for the timing. Feeder cattle become mature live cattle after a time delay. There are negative correlation effects involving the Canadian Dollar and U.S. beef products because Americans may favor Canadian beef when the Canadian dollar is weak against the U.S. dollar - that is, when imports and exports move freely across borders. This relationship will undoubtedly return to equilibrium when the safety of this important food supply is assured and acknowledged.
We looked into several other pairs of markets that present hedging or arbitrage opportunities for trading one against the other, or that demonstrate leadership tendencies. In examining them, youll see that the movement of correlated pairs of markets unveils opportunities that should not be ignored. The directional movement of one can often translate into a corresponding opposite movement in another. Pairing off risk in one market with an opposite position in another related market may be a sure way to profit from the opposing directional movement as demonstrated by the accompanying charts.
Through CSI's powerful correlation tables, which are provided free to UA subscribers through the csidata.com website, we employ statistical tools that can be used to monitor intermarket relationships and quantify the leadership qualities of any one market with another. The website shows the association between the Live Hogs and Pork Bellies markets based upon the statistical relationship between that pair of markets. This relationship can be seen with Unfair Advantage® by charting both markets and displaying a spread study as shown on page 1.
Consider the pairs of markets we have identified here, and then use your imagination and the software at hand to explore opportunities that you never dreamed were possible. Using your powerful UA software to explore world futures markets, consider the pairs enumerated [below]. You may be required to appropriately weight and time the pair by trading differing quantities and forward deliveries of each, but the possibilities are there for you to explore. With nearly 100 futures exchanges and 800 or so world commodities reported by CSI each and every trading day, the opportunities are nearly boundless.
Intermarket pairs to consider:
Eurodollar (ED) & British Pound (BP)
Unleaded Gas (HU) & Crude Light Oil (CL)
Long Gilt (FLG) & London Wheat (LWB)
CAC 40 Index (FCH) & COMEX Gold (GC)
Nikkei Index (SSI) & Tokyo Platinum (JPL)
Futures trading is not suitable for everyone. The risk of loss can be substantial.

Bob Pelletier
New Web-Based Service
CSI is pleased to announce a new category of service involving access to On-Line Correlation Statistics from the CSI website. This service is offered to people who do not access daily updates through Unfair Advantage, QuickTrieve® or commercial services.
Subscribers will receive a User ID and password to allow access to the restricted Correlation portion of the CSI website. Regular CSI subscribers need not subscribe to this service, as they already have free access using their existing User ID and customer number when visiting the site.
The price for accessing only On-Line Correlation Statistics is $24 monthly. A discounted rate for annual prepayment is $8 per month ($96 per year). Contact CSI marketing at 800.274.4727 or 561.392.8663 to subscribe.
Tech Talk
Each month in this column the CSI Technical Support Staff addresses topics of interest to many subscribers in a question-and-answer format. This month they discuss using CSI products for spreads and intermarket analysis.
Q. How can I evaluate markets for intermarket straddles when their prices are very dissimilar, e.g. comparing the Dow Jones Industrial Averages 10,000-point value with the price of gold - roughly $400 an ounce?
A. The correlation tables on the UA website incorporate significant mathematical manipulations to make the comparison. Customers are invited to view these and programmers are invited to make similar calculations using UAs API. When such comparisons are made using UAs basic charting features, care should be taken to assure correct interpretations are made. We suggest UAs spread feature as a starting point in making valid comparisons.
Q. How do I create a spread chart with Unfair Advantage?
A. First create charts of the two time series you wish to spread. These can be different delivery months of the same commodities or different markets altogether to form an intermarket straddle. Select the basis chart by clicking on it, then pull down the Chart Tools menu and select Overlay Data Chart from the menu. The default selection on the Choose Chart screen will be the one chart to be overlaid, so click [OK] to proceed. Both series will display in the same window.
Go to the Chart Tools menu again and select Study Toolbar. This will bring up a list of standard studies. If you havent charted spreads before, spread wont be listed. Click the [Add Study] button, and then, on the Select Study screen, click the arrow to drop down the list of available studies. Click Spread and then [OK].
A study called Spread ZScore Zero will be added to the Study Toolbar. Place your cursor on that study, click your mouse and drag it onto your chart. Release the mouse button to drop the study there. UA will begin calculating spread values and will soon display them in chart form.
Numerical spread values can be viewed in the Crosshair Readout panel. You can also load them into a word processor or spreadsheet (such as Excel) by opening the file OUTDATA in your UA directory immediately after the study appears on the chart, and before any other studies are run.
Q. When considering straddle trades between two different markets, what type of futures data should I analyze?
A. Individual futures contracts are too short-lived for in-depth analysis, and their brief period of high volume and liquidity further reduces their value to the analyst. Long-term computed contracts are recommended, with Perpetual Contract® data being our favorite. This unique blending of usually nearest and next-nearest contracts allows the analyst to focus on the center of liquidity at all times. The correlation methodology used on the CSI website features Perpetual Contract Data because it is ideal for viewing differing markets in an identical forward-time perspective. Be aware that in most cases, further manipulation is required to produce identical value perspectives.
Perpetual Contract is a Registered Trademark of CSI, representing the proprietary method of futures market calculation developed 30 years ago by Bob Pelletier. Only those firms who specifically state that CSI is the source of such data have the legal right to advertise, use or sell data products called Perpetual Contract Data. The integrity of firms who use our trademark without permission speaks for itself. We encourage our readers to question all non-CSI use of the term Perpetual Contract data, and patronize only those reputable vendors who honestly recognize CSIs intellectual property rights.
800-274-4727 | 561-392-8663 | 561-392-1379 (Fax)