I just returned from a Las Vegas vacation where I came to understand the nuances of the slogan: What happens in Vegas stays in Vegas." I dont know about any private shenanigans, but out on the gaming floor, an apropos interpretation might be, The money you bet in Vegas stays in Vegas. Thats not to say that the gamblers werent having fun; most were. In Las Vegas, playing the game is its own reward and the gamblers bankroll is merely the cost of admission.
Although I did enjoy my vacation, I chose not to risk any capital in the casinos. Some clever puzzler figured out that if you rearrange the letters in SLOT MACHINES you get CASH LOST IN ME,* which is just about the most apt un-jumbling Ive seen in a long time. Betting on something where the odds are stacked against me isnt my idea of fun, considering that the house takes 1% to 10% per pull of the slot machines handle. I prefer to play the trading game because I believe the financial markets offer a venue where I can actually win. Heres my kind of slogan when it comes to money: Whats in your investment account stays in your investment account, and grows!
Recent developments here at CSI are offering traders opportunities that lead farther and farther from the slot-machine model and closer to success through technology. I see evidence every day that by exploring the right data sets and applying appropriate analysis, the risk of investment losses can be significantly reduced and the odds of winning can be greatly increased. Our Unfair Advantage software was named specifically for its ability to tilt the odds in favor of the investor, and it continues to earn its moniker. I encourage every Unfair Advantage subscriber to fully explore this tool, alone or in conjunction with other third-party software, as it can enhance the profitability of your trades.
The unique CSI products that can help you turn losses into profits are many and varied. Youll find some on the CSI website at www.csidata.com; some are on the Unfair Advantage menus as Trading Tools, and some are data sets that are found within the Unfair Advantage database. Here are a few examples:
Third-Party Compatibility
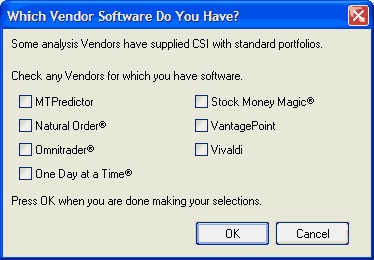
One great feature of Unfair Advantage is the wide range of third-party analysis programs that are available for use by our customers. The number of software programs for which we automatically install and maintain portfolios has increased to seven, including VantagePoint, MTPredictor, One Day at a Time®, Stock Money Magic®, Vivaldi, Omnitrader® and Natural Order. See the user-friendly selection screen at left. Other programs, such as MetaStock and Excel are supported through custom portfolios created by UA users through simple data selection screens.
Unfair Advantages third-party software support.
Database Innovations
We love data here at CSI, and we collect just about everything that might in some way help our users. We try to capture every world market, every usable government report and every new product and indicator, whether or not it has direct trading applications. When it comes to data, exploration leads to discovery. Unfair Advantage lets you explore the universe of investment opportunities in myriad ways. You can gain a historical perspective through capturing and viewing unemployment statistics, U.S. balance of payments with the rest of the western world, average wages by industry category and more, in addition to U.S. Government fundamentals that are typically compiled with your tax dollars.
Commitments of Traders (COT) series, made available by the Commodity Futures Trading Commission, are also included in the UA database. We find this information especially valuable. With this data set, the CFTC discloses market movement by the three critical categories of large commercial interest, large trader interests and small trader interests. These elements of data keep the trader advised on what forces are driving the markets up or down. See sidebar for more on interpretation of COT data.
CSI is the only current and historical source of commodity futures options data. This database is second to none in predicting the future course of nearly every U.S. commodity and U.S. stock index market of any consequence. You may hear more on this very soon in forthcoming editions of this newsletter.
Newspaper readers are database users when they view the daily financial pages; CSI database users have the advantage of seeing a blow-by-blow account of what led up to today. The added dimension of the historical perspective offered through CSI allows the user to appreciate the past and mentally project ahead.
Helpful Commentary
This newsletter, published monthly for about 25 years and now available on the CSI website (www.csidata.com), represents an important source of information for traders. We have tried to introduce novel and original ideas that we believe will improve your trading skill, particularly in ways that involve our data and software. Not only is there abundant commentary for review, but our newsletter also identifies every new U.S. Initial Public Offering (IPO) as well as stock splits. We also disclose every error we commit each month. When you have some time, why not explore this vast repository on our website?
Software Innovations
Each of the tools in the CSI inventory of trading products may be helpful to individual traders, but you have to get more involved to see which are best for you. For instance, stock index and sector data offer market visibility you wont find anywhere else, but youll still need good applications to put them to use. By viewing this information within Unfair Advantages Market Specs Factsheets and using them as sort and filter keys within UAs MarketScanner, you can hone your list of promising investments.
For example, suppose you heard a market guru recommend investments in the Technology sector for reasons that make sense to you. You want to invest in that area, but the gurus picks dont match your selection criteria for one reason or another. What else might be good? Find out by running a scan on just those stocks in the Technology sector. The scan list itself will let you view and sort by fundamentals such as earnings, dividends, average P/E ratio, change in P/E ratio, etc. MarketScanner will also let you view a set of technical indicators on each stock in your narrowed list, and even re-scan the list with technical analysis of these stocks. If you havent tried MarketScanner for these types of studies, you should!
User-Defined Programming
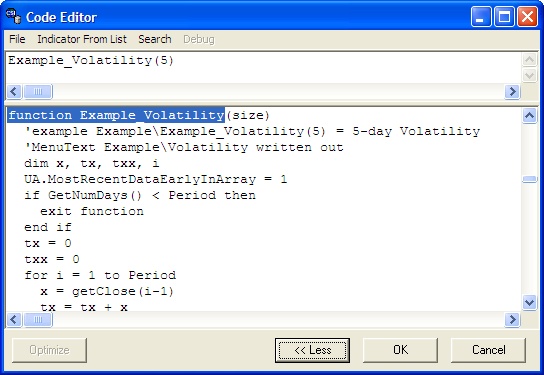
Do-it-yourselfers hit the jackpot with Unfair Advantages Interpreted Study mode. This feature allows you to view the actual programming code for many technical indicators and then execute those studies as either graphic images on Unfair Advantage charts or as screening tools in MarketScanner. Best of all, you may modify the code as desired or use these programs as models for designing new analysis programs of your own. Once programs are written and saved, you can add them to your favorites list to use over and over again. See sample code below.
Unfair Advantages Interpreted Study code editor.
We Like Winners!
The important thing to know about CSI is that our customers are encouraged to use our products to improve your trading outcome using whatever tool or tools best fit your needs. Las Vegas gamblers can be removed from any casino for any reason, most especially if a player has found a way to consistently beat the casino. This privilege is written into the law governing all Las Vegas casinos, so if you are a consistent winner, you are not welcome there. Fortunately, the stock and futures markets have no such restrictions on legal profit-taking. Rest assured, no customer will be denied service from CSI or your brokerage company because you happen to be a consistent winner.
I preferred Las Vegas to the newlywed, over-fed and nearly dead scene you find on most cruise ships because it was a fun and exciting place to be. However, its not the proper venue for building a secure financial future or for financing your childrens college, retirement or a dream home. I truly believe that the financial markets offer the best of both worlds: fun, excitement and profits. Theres no better tool than Unfair Advantage for helping you keep your investment capital as it should be -- in your account, and growing!
Bob Pelletier
* From the anonymous e-mail humor piece titled Too Much Time On Their Hands.
Other Trading Perspectives:
Steve Brieses Bullish Review - We are subscribers to this helpful and thought-provoking publication. It focuses on Commitments of Traders information to keep traders on the right side of regulated U.S. futures markets. Please call 888-423-4950 for more info and a free sample report.
Nelson Freebergs Formula Research Newsletter - This publication offers a new systematic trading approach each month that is designed to enhance trading success. (901) 756-8607.
Each month in this column members of the CSI Technical Support staff present topics of interest to many CSI subscribers. This month they share questions and answers about recognizing active and inactive markets, adjustments made when combining markets, minor discrepancies that can occur when using the UA back adjuster and creating a spread chart with Unfair Advantage.
Q. How can I tell if a futures market listed in the CSI Market Specs factsheet is actively traded?
A. That depends on your definition of "active." As you review the listings, you'll see that some markets are labeled "Inactive." Others provide the additional clue of having an apostrophe (') in the symbol. All of these markets are "inactive" as in defunct and no longer traded at all. They should be ignored. To find out which markets have higher volume than others, look at the "Average Total Volume" column of the factsheet. UA has a preferences screen called "Market Spec Behavior" that allows you to include or exclude inactive stocks and futures from the factsheet. See the online manual to learn about this feature.
Q. Some of the futures markets listed in the factsheets show "Average Total Volume" figures that are identical to the "Average Total Volume" figures for other very similar markets. A few examples are #50 and 148 (both Robusta Coffee), #359 and #941 (both MIB Index) and #319 and #956 (OMX Index). Are these different contracts of the same underlying commodities? Do they exist over the same time period?
A. The reason for the identical volume figures is that these series were combined to accommodate the phasing out of older markets and the emergence of new ones.
We'll use Robusta Coffee to illustrate: CSI #50 is the old (now defunct) Robusta Coffee, traded in British pounds with a contract size of 15,000 tonnes. CSI #148 is the newer version of the same commodity, but it is now traded in U.S. dollars with a contract size of 5 tonnes. When #148 began trading in April 1992, our customers requested that we include the historical data from #50 to create a longer data series. Combining the series required that the data added from #50 be multiplied by a fixed number to blend the two series without a serious discontinuity in price.
In the case of the MIB Index, CSI # 359 is the now-defunct series. Although it has been completely replaced by #941 (the MIB S&P Index) they traded simultaneously from March 2004 to September 2004. We carried both series under their respective CSI numbers at that time. When #359 stopped trading, its history was added to #941 to create a longer data series for analysis.
The OMX data was recently adjusted to accommodate an upcoming changing of the guard. CSI #319 (OMX Index) which is described as a forward index, stopped trading on June 22, 2005. It had already been replaced by its successor, #956, which is a futures index that began trading on February 14, 2005. Data from #319 has been added to #956 to create a longer data series.
Some of the points covered here are already in the footnotes which appear at the bottom of the screen when you click on the market entries. We are in the process of reviewing and revising the footnotes to include any information that may be missing.
Q. I'm using Unfair Advantage's standard (not C++) back adjuster (without the "Raise Negative Series" function) along with a similar algorithm of my own. Most of the time, UA's results maintain a constant difference from the results of my application, but on certain contracts, there is an unexpected (though now predictable) .05 point discrepancy. What can you tell me about this?
A. When back adjusting a file, conversions from points to dollars are performed for each day of the series, delving perhaps decades into the past. In this case, it seems that as much as one binary bit of precision is lost from a 32 bit (4 byte) price. Rounding errors of low insignificance such as this are not uncommon when dealing with a lengthy series, due to the cumulative effect of converting from points to decimal or decimal to points many thousands of times. (There are nearly 15,000 days of history in our CBT corn data, for example. It would be quite easy to add or drop a single terminal bit out of a 32 bit "word" length in those 15,000 conversions.) All PCs have the same level of precision, so a correction would require moving to double-precision arithmetic. Given the minor significance of the deviation, it is not a priority at this time; we consider it within an acceptable margin of error. This flaw has not been reported in the C++ version of the back-adjuster, so you might consider using that version if greater precision is required.
Q. How can I make a spread chart with Unfair Advantage?
A. Start by creating separate charts of the two series you wish to compare in your spread study. Next click Unfair Advantages Chart menu and then choose Overlay Data Chart. Your two data series will instantly display in the same charting window. If more than two charts are active within your UA environment, youll be asked which chart to overlay.
Next click the Indicators icon on the charting toolbar, or go to the Chart menu and select Study Toolbar. Either way, the study toolbar displays, which is essentially a customized favorites menu. Assuming you havent already added Spread there, you may do so now by clicking the [Add Study] button. This brings up the Select Study screen. Click the arrow beside selection box to display a menu of basic studies, from which you will choose Spread. Next click [OK]. The Study Toolbar displays again, but now Spread ZScoreZero is one of the choices. (This is a basic spread.) Highlight it and then click the [Apply] button. Youll be asked to select the pane for charting. If you want to superimpose the spread over your bar charts, click Pane 1. To display the spread in its own window, choose Pane 2. Your spread study displays. Click the X at the upper right corner of the Study Toolbar to close the menu and re-display a full-size chart.
To remove the spread study, click the Chart menu and then choose Clear Studies From Chart.
CSI is seeking experienced UA users to test our upcoming Unfair Advantage v. 2.9. It offers several enhancements, including the ability to receive the new CSI Futures Index," which is a market-direction index that has an uncanny ability to confirm good trade signals. The Index will be available only through UA v. 2.9 and, after a testing period, only to those subscribers who pay a premium for the service. It will be FREE through 9/05 to registered Beta Testers of UA v. 2.9.
Notice:
The views and information expressed in this document reflect the opinions and experience of the author Robert C. Pelletier. Neither CSI nor the author undertake or intend to provide tax advice or trading advice in any market or endorse any outside individual or firm. All recommendations are provided for their informational value only. Readers should consult competent financial advisors or outside counsel before making any software purchase or investment decision. CSI does not stand behind or endorse the products of any outside firms.
Website Links: This CSI website and Unfair Advantage system contain hyperlinks and automatic links to websites operated by parties other than CSI. No association with or endorsement of third-party websites should be inferred through these links. They are provided for your convenience and reference only. CSI is not responsible for and has no control over the content of third-party websites.