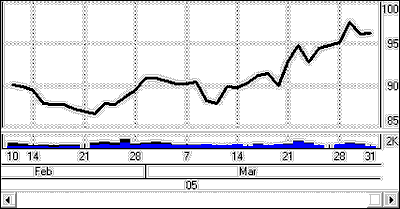
| · | Close Only - one dot per reporting interval. UA connects them and displays as a line:
|
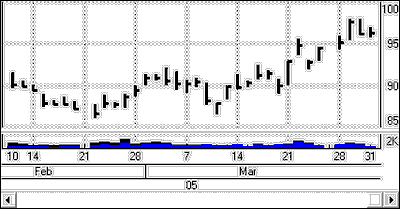
| · | High Low Close - standard bar chart without opens. The top of each bar represents the high; the bottom of each bar represents the low; the dash to the right indicates the close:
|
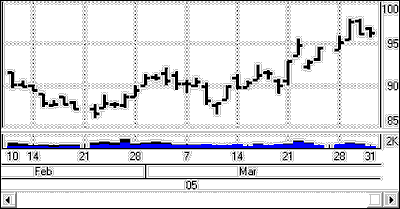
| · | Open High Low Close - most detailed bar chart. The dash to the left indicates the open price; the top of each bar represents the high; the bottom of each bar represents the low; the dash to the right indicates the close:
|
| · | Candlestick - charts present price data in a different form from a standard bar chart. To produce a candlestick chart, we plot daily high and low prices as a wide vertical bar. Open and closing prices are plotted as dashes crossing the high/low bar. The body of the bar creates a box. The resulting formation resembles a candlestick that burns from both ends. If the closing price is higher than the open price, the box is "white" or "clear." If the closing price is lower than the open price, the box is shaded (solid):
|
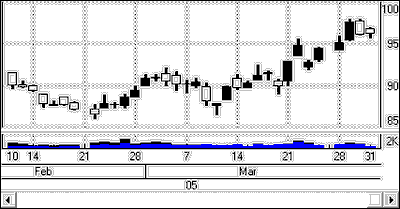
| Traders have developed colorful terms to describe candlestick chart formations, including spinning tops, hanging man, dark cloud cover, etc. These formations, alone and in combination with others, identify market posture as bullish or bearish and give reversal signals.
|