A Gann contract chart reflects a continuous series built from a single delivery month of a commodity over years of trading. It might show many years of May Wheat contracts over time, for example. The desired month and roll-forward criteria must be specified when creating this type of chart. Each individual contract occupies a 12-month segment of the chart, so each contract of the selected commodity must trade at least 12 months. Gann charts are named after their creator, the renowned commodity trader W.D. Gann.
To create a Gann chart, begin by selecting the futures market or markets and making other common charting selections as described in the "Futures Charts" topic.
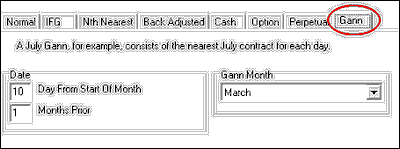
From the center region of the Selecting Data Series screen, click the "Gann" tab, which is at the far right (see below). Our example shows a selection screen for CBT Corn, CSI #9, symbol C.
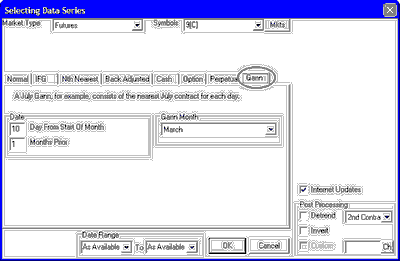
Selecting Gann Settings
The "Gann" screen shows the settings you may customize for your Gann Contract charts:
You'll need to select the appropriate response for each of the following:
Date
Day From Month Of Start: This setting lets your Gann contract series roll from one contract to the next on a specific day of the month. In the box to the right of this prompt, enter the roll-forward date (1 to 31) within the rollover month. Use 31 to roll on the last trading day. This date is within the rollforward month specified below.
Months Prior: In the box to the right of this prompt, enter the number of months prior to the contract's expiration month when rolling should occur. Enter 0 for rolling within the expiration month, 1 for one month prior, etc. Use 0 for the last trading day.
Gann contracts typically roll upon expiration, for which Day 31 and Months Prior 0 would be entered. You might prefer a more consistent date such as the first day of the expiration month (1 Day and Months Prior 0).
Gann Month
This selection identifies the one delivery month to be included in your Gann series.
Click the down arrow at the right of the text box and select the single delivery month to be used. It will cycle through the different delivery years. If contracts of the commodity you selected trade for less than 12 months each, your Gann file will contain periods where no data is supplied.
UA will roll into the same contract month for each subsequent delivery year (March rolls into March; May rolls into May, etc.).
Common Settings
Be sure to adjust the date range and post processing settings (if desired) as described in the "Futures Charts" topic before finishing your selection.
Click [OK] to display your chart(s).
This topic completes the "Creating New Charts" chapter.
See the Chart Interpretation & Manipulation chapter for information on managing your chart. Consider using the "Save to Portfolio" feature to save your charts for future use.