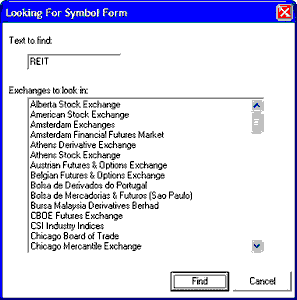
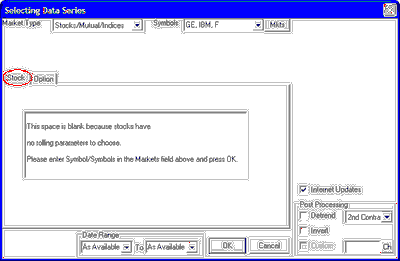
The "Selecting Data Series" screen displays, allowing you to select one or more data series for charting:
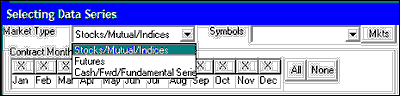
Market Type
|
Stock, Fund & Index Charts
|
Previous Top Next |
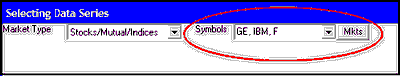
| · | Symbols entered must match the selected "Market Type."
|
| · | Symbols must be separated by a comma, a space or both, as shown in the above example. Here we show a request for charts of General Electric (GE), Int'l Business Machines (IBM) and Ford Motors (F).
|
| · | An alternate way to identify the stocks for charting is to enter the CSI number, such as 5159 for IBM. CSI numbers can be found in the Market Specs Factsheets.
|
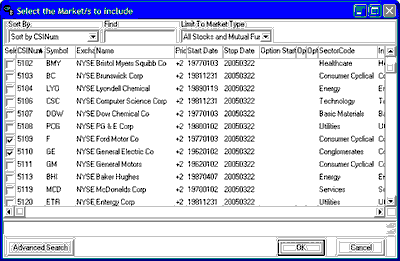
| · | Click [Mkts] to choose markets from the Market Specs list," if you prefer not to type the symbols. Click here for instructions.
|
|
|
|
|
| · | All Stocks and Mutual Funds
|
| · | US Stock Markets
|
| · | Non-US Stock Markets
|
| · | World Stock Markets
|
| · | Mutual Funds
|
| · | Domestic Stock Index Futures
|
| · | Foreign Stock Indices
|
| · | World Stock Indices
|
| · | Stocks With Options
|
| · | CSI Stock Industry and Sectors
|
| · | Stock Market Data Stored as Futures
|
| · | CSI Number
|
| · | Symbol
|
| · | Exchange
|
| · | Name
|
| · | Price Format
|
| · | Start Date
|
| · | Stop Date
|
| · | Option Start Date
|
| · | Option Strike Dividend
|
| · | Option Price Format
|
| · | Sector Code
|
| · | Industry Code
|
| · | Earnings Per Share
|
| · | Shares Outstanding
|
| · | Number Institutional Shares
|
| · | Percent Institutional Shares
|
| · | Stock Beta
|
| · | Revenue Growth 5 Years
|
| · | Dividend Growth 5 Years
|
| · | Dividend Yield
|
| · | Price Earnings Ratio Average 5 Year
|
| · | Latest Annual Operating Revenue
|
| · | Price Earnings Ratio
|
| · | Has Fundamental Data
|