
[Click here to return to journal index]
July 2006
CSI Technical Journal
Volume XXIV, Number 7
In This Issue
To Serve You Better
The Market Statistics Update, which includes recent stock splits, IPOs, additions to the database, deletions, changes and the monthly error report, can be found in the online version of this Journal at www.csidata.com.
Holiday Schedule
CSI will be closed for voice communication on Tuesday, July 4th in observance of the U.S. Independence Day holiday. All U.S. exchanges will be closed. Data from other markets will be available at the normal posting times, and the CSI host computer will be accessible as usual.
Exploring Trading Opportunities Through The CSI Market Data Service
CSI's Unfair Advantage software has received a lot of attention over the years, in part because of its provocative name. What advantages does it provide to traders? Unfair to whom? Does this software truly give its users the upper hand in the markets, as the name implies? These are fair questions that deserve thorough answers. This month's CSI Technical Journal will delve into the many ways the Unfair Advantage can completely fulfill the traders needs and, perhaps more importantly, into the culture of reason that prevails at CSI. Our goal is to foster trading success by providing comprehensive tools for thoughtful decision-making based on multiple areas of study, and upon the cleanest market data offered.1 We hope that this article will help CSI customers and potential customers fully understand the advantages that are inherent in the multi-faceted Unfair Advantage system and from CSI Market Data services.
It seems that traders today obtain much of their investment guidance and perspective from monthly newsletters and magazines that often publish feature articles on company C.E.O.s hyping their latest-and-greatest analysis method. Inevitably, the writer explains the newest twist that makes the study du jour more able to capture speculative profits than last months favorite. The implication is that you, too, can apply this new technique to beat the market. The featured studies often share the common theme that price today will suggest and predict price tomorrow. Unfortunately, such systems generally work about half of the time.
This CSI Technical Journal is an example of the type of educational material we prefer at CSI. We attempt to inform our readers -- mostly CSI customers -- about new markets, innovative products and even traps that the successful trader must avoid. In trading, it pays to capture information from several sources that can reliably be employed in unison to predict the future movement of a stock, option or futures market. I believe that fundamentals consistently set the tone and can help the trader make wise decisions. The culture of reason I promote involves giving at least some attention to intermarket fundamental information. This focus is readily found in our publications and is readily applied through Unfair Advantage and CSIs website services.
Unfair Advantage is a full-fledged trading product that can tell you what and when to trade. We are known for our data, but there is much more available to our customers that will help you to make profitable trading decisions. There are a number of important factors that one should consider before launching a trade. Directional price movement, easily viewed in Unfair Advantage charts is important, but many other factors should also be considered. As you might have already guessed, all are available through Unfair Advantage and all lean heavily toward fundamentals. Here are a sample few:
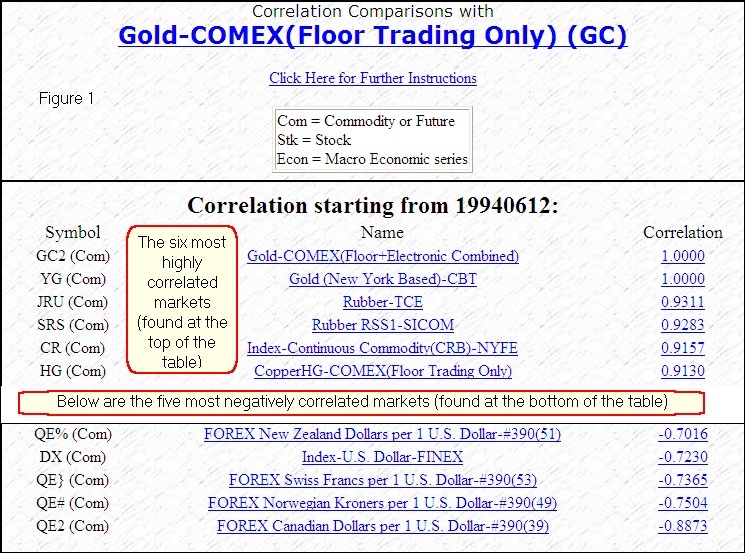
1) Correlation - Markets do not exist in a vacuum. Before considering a trade in a given market, explore all possible markets that coexist in the world economy. The CSI website will display tables and Unfair Advantage can produce a matrix of futures and stock symbols showing their level of correlation with each other in statistical terms. This could involve a huge matrix of pairs of individual time series covering potentially many thousands of markets.
Correlation studies such as these make it easy for the user to pair up negatively correlated markets (those that move in opposite directions) for profitable intermarket straddles, and also to find highly correlated markets that tend to move in tandem. Pairs of positively correlated markets can be predictive of each other, but grouping similar trades in correlated markets within the same portfolio is discouraged because they could easily snowball to produce excessive losses. CSIs correlation studies, unique only to CSI in the high-tech market trading community, will spare you from this fate. For a nominal fee, CSI subscribers may access in-depth correlation studies between pairs of thousands of stocks, pairs of over 1,000 world commodities, and pairs of both market areas, all through CSIs website or through the Unfair Advantage software.
The Gold correlation table (Figure 1) below, was pieced together from the CSI website. It shows which markets bear the highest positive and highest negative correlation values to COMEX Gold. The corresponding double bar chart of gold and copper (upper chart) demonstrates the tendency of highly correlated markets to move in tandem, and the chart of Gold and the U.S. Dollar Index (lower chart) shows the relatively inverse relationship of markets with a fairly high negative correlation value. These charts and table fulfill the wildest dreams of even the most accomplished economists, and are provided to you, our readers who are interested in seeking out profits from statistics previously only available to professional researchers.
In the chart shown as Figure 2, the initial data series (COMEX Gold) is named at the top of the screen. Its bar chart is displayed in black, as is the corresponding price scale (at right). We have overlaid a second chart (COMEX High Grade Copper) which is named in blue within the charting window. Its bar chart and corresponding price scale (at left) are also in blue. The chart shows gold and copper moving together, as would be expected for markets with the high correlation coefficient of 0.9130. The trader should avoid trading both of these markets at the same time and in the same direction, because a wrong move could easily result in a simultaneous loss in both markets. (This phenomenon was fully explained in our previous monthly Journal so you might want to take a second look.) However, should the trader take a long or short position in just one of the pair, the better choice would likely be the market that appears to be lagging behind. In adopting this approach the high correlation coefficient would suggest that there is a better-than-average chance that the lagging market will likely catch up (recover) to near the market that leads.
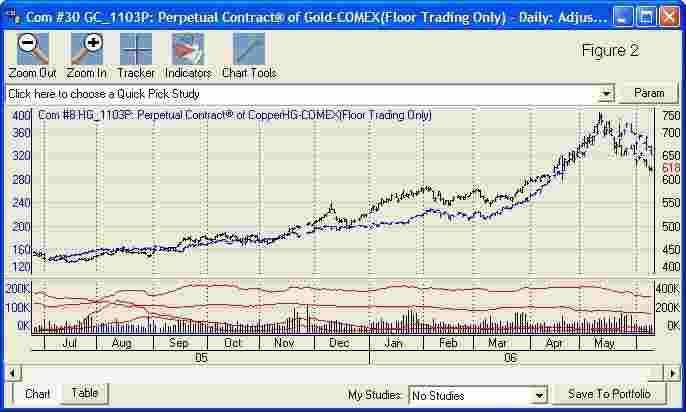
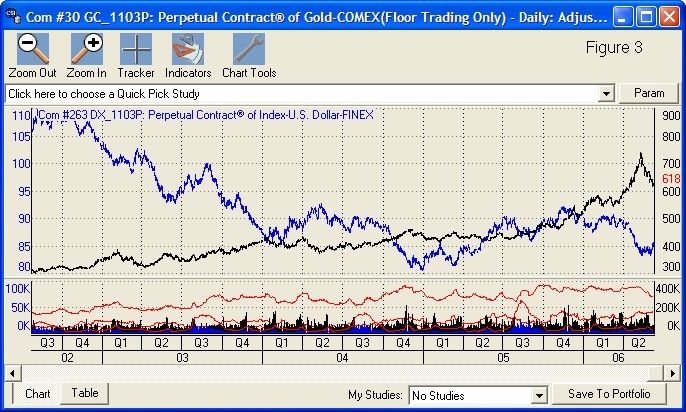
COMEX Gold with COMEX Copper, a correlated market (Figure 2) and with the U.S. Dollar Index, a negatively correlated market (Figure 3).
In the next chart (Figure 3) the initial data series (Gold) is named at the top of the screen. Its bar chart is displayed in black, as is the corresponding price scale (at right). We have overlaid a second chart (the U.S. Dollar Index) which is named in blue within the charting window. Its bar chart and corresponding price scale (at left) are also in blue. This pair of markets is negatively correlated with a correlation value (-0.7230). Notice that the Dollar Index seems to be turning up while the Gold is turning down. In this situation, the wise trade might be the simultaneous sale of gold and purchase of the Dollar Index. Be careful to keep your dollar value of risk comparable for the spread transaction by weighting the contract exposure for the pair of contracts so that the dollar value is similar. For example, a 5% drop in one should be roughly equivalent to a 5% rise in the other. This balancing requirement avoids risk imbalance between the two opposing trade.
2) Market Seasonality - In addition to examining the markets that are directly related to the one you propose to trade, check your markets behavior relative to its historical seasonal movement. Nearly every market has a seasonal waveform, and Unfair Advantage can bring you to that waveform so that you can conform your trade to those important seasonal forces. Products that depend on rain or sunshine are certainly prime prospects for such research. UAs Seasonal Index study looks at seasonality on a 251-day trading year (over all years of historical experience), not on a coarse twelve-point monthly simplification that is used by some of those C.E.O. gurus we mentioned. Our method captures and responds to all of the interesting daily fluctuations. Engage Unfair Advantages Seasonal Index study to observe how the seasonal waveform changes as more and more history is added.
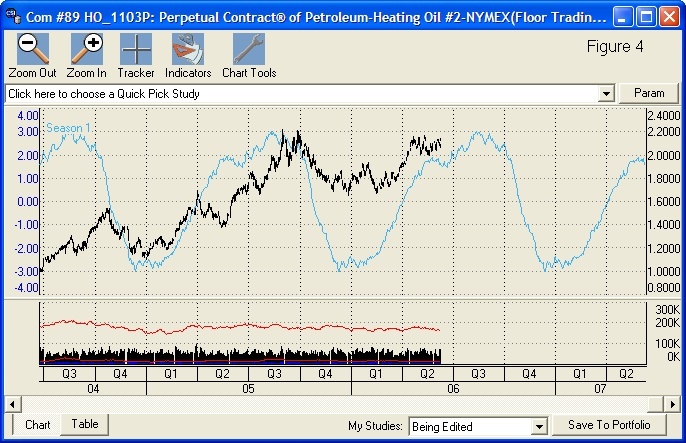
This Perpetual Contract® data chart of Heating Oil shows price activity and CSIs exclusive Seasonal Index study. Source: Unfair Advantage.
The bar chart below shows the last two years of heating oil data and the mature one-year forward wave form of the derived seasonal index that was developed day-by-day from nearly three decades of historical heating oil statistics. For a full picture of the gradually developing seasonal waveform, direct your UA software to show all historical data on file, and gauge for yourself if a repeat is likely based upon the history of the market you choose to investigate.
3) USDA Commitments of Traders (COT) - This is a very significant element for regulated markets that can tell you what the big guys are doing. The U.S. Department of Agriculture tracks agricultural markets and other markets important to the U.S. economy according to classes of trader interests. They segregate these markets according to the three classes of Large Commercial Interests, Large Traders and Small Traders. These classes are defined according to the size of the open interest in each of the categories. Unfair Advantage puts this information on your computer screen both numerically and graphically. By monitoring the categories through CSIs weekly COT updates, the trader can gain an understanding of the distribution and should favor the larger commercial interests, and/or trade contrary to the small trader interests. Knowing which traders are in the various categories is helpful and, in fact is invaluable in forecasting market directional movement. CSI supplies the weekly USDA data from both the Commodity Futures Trading Commission (immediately upon release to all subscribers) and from Steve Brieses weekly Bullish Review publication.
Want more information on COT data? Contact Steve Briese at (888) 423-4950 and ask about a subscription to his insightful weekly commentary in the Bullish Review.
4) Put/Call Option Interest - The volume of put options relative to the volume of call options is typically shown as the ratio of put contracts divided by the volume of call contracts. Speculators who expect the value of individual contracts to fall in the future buy put options, which are essentially bets that increase in net value when prices for the underlying market decline. Speculators who expect prices to rise in the future buy call options. When the ratio of the puts vs. the calls advances above unity, the majority of option traders expect lower prices in the near term. The reverse is true when the ratio moves below unity. The put vs. call ratio may not always move consistently according to hard-and-fast rules, but we have seen some consistent predictable behavior when the put vs. call ratio is coupled with a simple moving average of price behavior over time. We have found the put/call ratio data set, which is available to CSI subscribers through Unfair Advantage, to be very helpful in forecasting market direction. This put/call data is a premium service supplied by CSI, which is the sole U.S. source for this enormous database of important information.
Data Delivery
To fully understand the benefits of Unfair Advantages data delivery system, one must first recognize its inextricable connection to CSIs world-class database, which is the source of Unfair Advantages daily updates and historical data. Over several decades of development, CSI has slowly added more and more information in our data repository to become the premiere daily market information vendor in the U.S. Originally formed in New York State in 1970, when CSI supplied only daily summary data on a limited list of commodities, CSI and the CSI database have steadily grown. In response to the ever-changing demands of CSI customers, the database gradually expanded to include daily information on U.S., U.K. and Canadian stocks, nearly all world commodities, commodity futures options, stock index options, U.S. Government fundamentals on trade, econometric statistics on U.S. commerce, housing and unemployment, and much more. Additional world markets are added to the CSI database as information is made available.
The overall content of CSIs database offerings provided through a UA subscription includes perhaps the entire historical record on nearly 50,000 stocks, 25,000 mutual funds and over 1,000 futures markets traded worldwide. Each trading day, exchanges in the major world capitals contribute local information on products traded domestically to the CSI database. Nearly 100 exchanges are represented.
Input from each exchange is meticulously screened by CSIs data banking staff. They do a remarkable job in keeping the data in pristine condition, so errors are almost universally identified and corrected before posting and before delivery to CSI customers. Based upon their research, we report a very short list of any significant defects they may have found each month in the CSI Technical Journal. Despite and because of our attention to accuracy, we listen to and research each and every customer concern about data integrity. We are forever diligent in maintaining a database of impeccable quality. CSIs accuracy is well known around the world. Perhaps this is why Yahoo!, Microsoft Network and 100 other international redistributing firms choose CSI as their premier source of end-of-day market information. The ramifications of using inaccurate or unreliable data are far reaching. They can include such ills as false trading signals, flawed computer models and a lack of confidence in ones own research. Traders and analysts who require unmatched data integrity understand this distinct advantage of CSI Market Data.
The Package
The typical Personal and Private Use subscriber of CSI Market Data services is provided with an Unfair Advantage CD ROM that holds a massive historical database on the users choice of several broad market segments such as futures, cash markets, U.S. Stocks, foreign stocks, put/call ratio data on commodity options, etc. The full database typically reaches from the first day of trading onward to the current date for all of the thousands of historical series supplied. At the users discretion and according to the users budget, the accessible historical database can be adjusted to span one or more decades or the entire history on file. Each day CSI customers log onto the CSI computer system in Florida through an automated Internet call and all market data in the users subscription category are downloaded. New data are then appended to the data resources stored on the users own computer. Commercial subscribers may also receive historical data and ongoing daily updates, but the process may be handled through alternate software.
CSI customers range from among the very largest information supply firms to the individual trader or researcher. We service researchers interested in trading, conducting economic theory studies, and exploring intermarket interrelationships. Individual traders from all walks of life make very heavy use of CSI data through Unfair Advantage. It is understandable that anyone who wishes to deal in and analyze data involving world market trading opportunities would come to CSI. Do Unfair Advantage users have a leg-up on analysts or investors who have access to fewer markets, who view less extensive historical data or who suffer more errors in their data files? I think they do, and I believe corporate customers who access CSI data through direct mainframe-to-mainframe transfers also benefit from the many advantages of using CSI data.
Although the CSI database includes strictly daily summary data on most markets, Unfair Advantage allows access to delayed intraday quotes on selected stocks and commodities as their prices unfold throughout the trading day. These intraday updates are retrieved free of charge from third-party websites and processed through Unfair Advantage. This service is to be used intermittently. It will not replace a real-time ticker, but it is handy for intraday portfolio valuations through Unfair Advantages Position Manager, which will express prices in the customers choice of currency, and/or for charting, where the most recent intraday quote will be displayed along with previous daily updates. The intraday information supplied is provided to satisfy the customers casual curiosity, but not for analytical purposes.
Lets be clear that CSI is an inter-day (day-to-day) update service and makes no attempt to provide tick-by-tick information as found at intra-day services. The choice to follow daily summary data should never be considered a shortcoming or a concession, as it is wise to eschew that which has little predictive benefit. As a market analyst with abundant experience studying the interrelationships between markets, I believe it is all but impossible to find cause-and-effect relationships through the use of intra-day information! Randomness prevails in intra-day market behavior, whereas inter-day data appropriately reflects outside influences that come from related market forces. In my experience, the shorter the time interval, the less predictive are the associated relationships between markets, and the greater the likelihood that randomness will prevail. I don't know many, if any, rich day traders. Do you?
Technical Analysis
In addition to the benefits of an impeccable database that all CSI subscribers enjoy and the fundamental data described above, users of the Unfair Advantage platform have access to technical trading tools that may provide incredible value to the home office researcher. Unfair Advantage users can also benefit from tools offered by third-party software vendors who work closely with CSI to provide seamless compatibility.
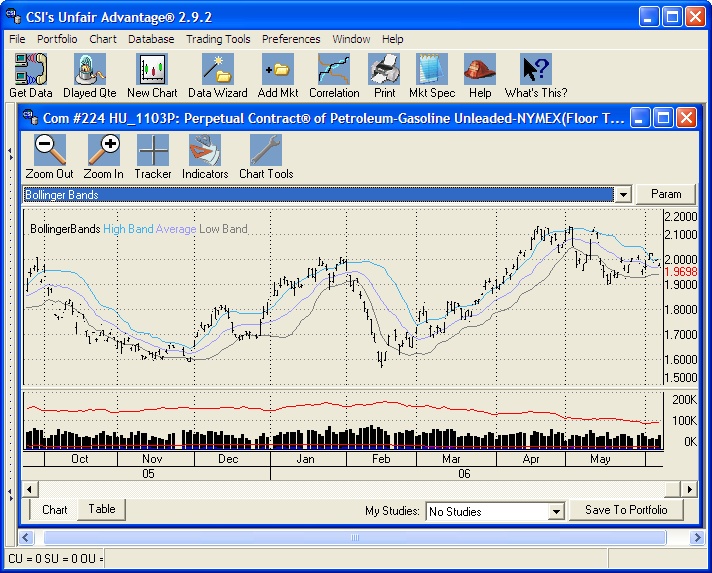
The Unfair Advantage user can choose from many analysis methods. Among these is a very generous listing of standard studies such as moving averages, oscillators, volume studies and many more. These are available from a quick drop-down menu above the Unfair Advantage chart. For more advanced analysis, Unfair Advantage offers a library of additional studies that can be optimized and customized by the user through our Study Toolbar. These studies are provided in workable form in three programming languages, including Perl, JavaScript and our own AnyLanguage, for use and experimentation. The imaginative analyst can reach beyond these previously published works to break ground on new innovations using Unfair Advantages code editor to tweak existing studies or invent new ones. Unfair Advantage studies can be charted or used in a scanning-and-screening mode to search for opportunities within the database.
An Unfair Advantage chart showing Perpetual Contract data for Unleaded Gasoline with the Bollinger Bands study.
System Certification
Once your trading plan is formulated from among the many analysis avenues suggested above, CSI customers should adopt another unique feature of Unfair Advantage; namely UAs Trading System Performance Evaluator module. This supplied software represents a Monte Carlo simulation that can be used to prove whether a given trading algorithm, when applied to a specific market or set of markets at a given funding level, is likely to produce consistent profits. I developed my Monte Carlo analysis skills while working on Radar Signal Processing assignments for General Electrics Advanced Analytical Methods Laboratory back in the 1970s and am delighted that the technique works so well for evaluating trading systems. This tool accepts as input your trading record over time (simulated or actual) along with information about the properties of the trading system. It also requires a statement of the profit goal you are hoping to achieve. When the input is entered, the Monte Carlo simulation can be applied and you will be apprised of the probability of success of your proposed account at the funding levels you can afford to finance. Trading System Performance Evaluator is designed to save you from unfortunate losses caused by simple underfunding, and can distinguish studies with substantial merit from those that are likely to fail. It can also give you the confidence you need to move boldly forward when a truly promising trading approach is discovered.
Does all of this add up to an advantage for the Unfair Advantage user? Of course it does! Is it unfair? Well, you get what you pay for, and those who arent willing to pay slightly more for this product will simply do without. Its a financial decision. When you consider that everything described here (and much more) is available for nominal rates below $100 per month for Personal and Private Use to perhaps thousands per month for commercial use, it is clear that the cost of excellence is not prohibitive. Simply put, Unfair Advantage possesses a peerless database, in-depth analysis capability and important statistical tools that make it easy to conduct market research and many other trading related pursuits as efficiently as possible. We hope that the guidance provided through monthly articles in the CSI Technical Journal also help make our readers more successful. So much is available for so little. We think every trader should explore the opportunities available through Unfair Advantage before launching their next trade.
Good Luck to all and happy trading.

Bob Pelletier
(1) How Clean is Your Data, Cover Story. Copyright 2003 Futures Magazine Group
Speed Enhancement
In the very near future, UA will be retooled in a form that will provide daily updates of massive market updates on nearly every world market on futures, stocks, funds, and options in perhaps one minute per day. We are hoping to soon release UA version 3.0 with these incredible speed improvements in place.
Notice:
The views and information expressed in this document reflect the opinions and experience of the author Robert C. Pelletier. Neither CSI nor the author undertake or intend to provide tax advice or trading advice in any market or endorse any outside individual or firm. All recommendations are provided for their informational value only. Readers should consult competent financial advisors or outside counsel before making any software purchase or investment decision. CSI does not stand behind or endorse the products of any outside firms.
Website Links: This CSI website and Unfair Advantage system contain hyperlinks and automatic links to websites operated by parties other than CSI. No association with or endorsement of third-party websites should be inferred through these links. They are provided for your convenience and reference only. CSI is not responsible for and has no control over the content of third-party websites.
All information and data on this website are © Copyright 2002-2005 by Commodity Systems Inc.(CSI) All rights are reserved.
800-274-4727 | 561-392-8663 | 561-392-1379 (Fax)