
Features
Unparalleled Market Data
You probably came to CSI for data, which is our specialty. You already know that we provide summary end-of-day market data, but did you know how very broad our offerings are?

- There are 110+ commodity exchanges in the world and CSI covers most of them.
- Many thousands of Futures contracts are reported each and every trading day.
- All Stocks traded in the U.S., Canada and the U.K. are reported.
- Options on Stock Indices, and most popular Futures are included.
- The full range of 20,000+ active US Mutual Funds are provided, complete with adjustments for capital gains and dividends.
- We provide Regular Trading Hours(RTH), Electronic Trading Hours(ETH), and Combined Futures pricing, along with a Cash price for many domestically traded Futures.
- All Futures series can be transformed into a multitude of continuous contracts.
- Nearly 160 FOREX currency ( & nearly 70 Cryptocurrency ) cross-rates are included
- Briese’s Commitments of Traders (COT) data and indicators are included.
- Click here to view complete market listings and specifications.

Accuracy is Everything!
Data accuracy is assured with Unfair Advantage, and every customer enjoys the same level of perfection. Errors do occur, but any suspicious data point reported by a customer or discovered by our staff will be subject to careful review and verification. If an error is confirmed, a correction will be transmitted the following day. An independent study featured in Futures Magazine found CSI’s error and omission rate lower than all competing data firms tested.
(Futures, 9/99 – How Clean is your Data?)
Quick and Easy Updates
Downloading data is so simple! Just click the Download Data button on the UA toolbar, or update automatically in unattended mode, based on our data release schedule. You can visit our website before you download to monitor CSI’s internal posting status of your favorite markets.
Compression Saves Disk Space
Unfair Advantage uses a proprietary serial compression to hold hundreds of thousands of time series in a relatively small amount of disk space. What would normally take nearly 30GB can now be stored in under 3GB. This makes updating faster, and management much easier.

Database View
The Database View is a great way to get an overview of daily closes, volume and the net change for individual issues. Access by your private portfolio or all futures markets at once.
Data Processing
- Stock data is provided unsplit, and unadjusted. We offer the option to apply splits, and to adjust for dividends. Dividends can also be adjusted proportionally, which can help reduce the effects of inflation, and also prevent accumulated dividends from driving the pricing down to zero, or below.
- Detrend a series to analyze data resources in today’s constant dollar terms. When back testing a trading algorithm or procedure on extended historical reserves, the detrend adjustment eliminates the tendency to treat past history with less weight.
- Export data in chronological or reverse chronological order.
- Format dates and decimals according to your region.
- Include price and percent changes in your export data, along with a lengthy list of other available fields, including technical indicator values.
- ETH pricing can be included with Combined Futures pricing, and RTH settlements can be included with ETH pricing.
- Data Splicing using the Symbol Link utility allows you to join related futures data series such as the BAX with the new 3-Month CORRA futures into one complete series for analysis and charting purposes:

- See our section on Continuous Contracts for more examples of data processing functionality.
Transform Futures into Continuous Contracts for back-testing your trading strategies
Unfair Advantage can transform raw futures contract data for a given commodity into a single continuous series that is more suitable for long-term back-testing than individual contracts alone.
Available strategies are described below:

- The Back-Adjusted Contract, where individual contracts are concatenated over time and adjusted by the contract price difference delta that provides smooth continuity to the data as each contract rolls from the current month to the next nearest month, based on rolling criteria. Roll criteria offered is by calendar date, or by trading day date, relative to the start, or end, of the delivery month; or by trading days before expiry date; or by the magnitude of volume, open interest, either volume or open interest, or both volume and open interest, in literal terms, or by a ratio, with the option of using multiple confirmations.
- The Proportional / Ratio Back-Adjusted Contract, which is the same as the above, but where the delta adjustment is done in percentage terms. This minor difference helps to avoid situations where a back-adjusted series may be adjusted down to zero, or below.
- The Nth Nearest Future Contract, which represents the concatenation of successive contracts over time, reflecting the price, volume, and open interest of the Nth nearest future. In this option, there is no attempt to account for step-size jumps or drops in price as contracts change from one to another. The same rolling criteria is offered here as with the Back-Adjusted Contract, with the option of choosing the 1st nearest contract, or the 2nd nearest, up thru the 36th.
- The Time-Weighted Perpetual Contract® data series, which reduces a given futures market into a single continuous series using a constant future-period-forward perspective measured in days and months.
- The Open Interest Weighted Perpetual Contract® data series, which reduces a given futures market into a single continuous series based on Open Interest, keeping the most active contract in focus, but weighting the pricing based on the distribution of Open Interest across all available contracts ( this can be reduced to a subset ).
- The Proportional Liquidity Contract, which is an OI Weighted Perpetual Contract that measures contract liquidity over the span of the life of the market by weighting the price differences per day with Open Interest across specified contracts.
- The Index Component Contract, which is a Nearest Future Perpetual Contract that splices contract pricing together over a specified time, using percentages determined by the size of this window. It resembles the sub-indices used by the Dow Jones-USB Commodity Index.
- The Gann Contract, where historical data is transformed into a series comprised of successive historical segments of the same delivery month, over successive years.
Portfolio Management Overview

Unfair Advantage is designed around one or more user-defined portfolios representing the various futures, stocks, funds, options, etc. you wish to actively follow. The value of a portfolio to the UA user is that all of the items in all portfolios are conveniently grouped and export files are automatically updated at data distribution time.
Your specifications for the computed contracts are stored in your portfolios, along with format and reporting frequency (daily, weekly or monthly) requirements for export files. Portfolios are designed to facilitate file updating whenever possible, but will totally re-create files from scratch when necessary. They make it easy to access charts and indicators, and supply data to other 3rd party software.
We provide a set of preconfigured portfolios for technical analysis software that work with Trading Blox™, Trading System Lab®, Real Test, and others. Various industry standard data formats are also available, including Excel.
Please watch our Introduction to the Portfolio Manager video for more details:
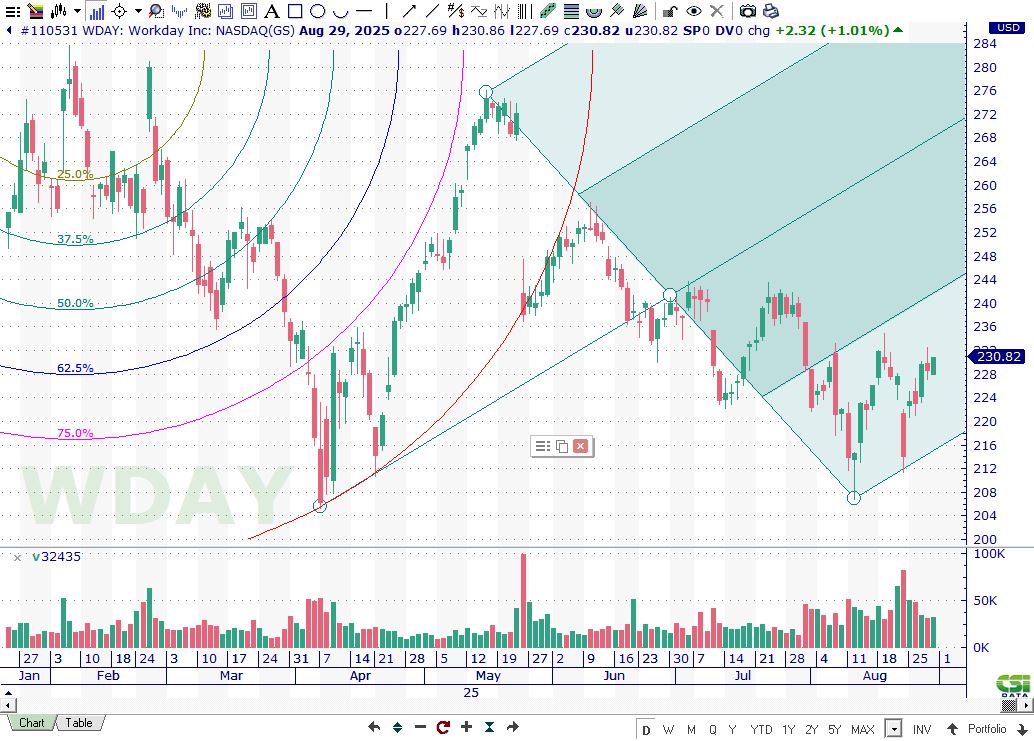
Comprehensive Charting Features

Our decades of experience with international traders and investment firms give us a unique knowledge of the tools that make a difference. Such as:


Our charts are designed to assist you with comparing one market with another, and add indicators individually, or as a template. Standard bar frequency controls are present for Daily, Weekly, Monthly, Quarterly and Annual periods. Fixed YTD, 1Y, 2Y, 5Y and MAX time frame controls are there, too. Tools can be drawn in selected colors, and charts can be annotated. You can to view OHLC bars, Candlesticks, Heiken-Ashi, Mountain, Midpoint, Line, or Steps.
Splits, and Dividends can be displayed on your charts as markers below the pricing on each ex-date. Futures contract roll markers can also be displayed below the pricing on each roll date.
Futures days, weeks, or months can be added to your charts so you can cast charting tools into the future.
From Trendlines that measure bar counts and profits/Losses across segments of time, to Regression Channels, Pitchforks, Fibonacci and Gann Fans, our charts provide a wide variety of helpful tools:
Technical Indicators
Our library includes over 100 built in indicators that can be applied to your charts, and/or exported with data, including:
- Alligator Oscillator
- Bollinger Bands
- Chaikin Oscillator
- Donchian Channel
- Keltner Channel
- MAC/D
- All types of Moving Averages
- EMA Crossover
- Raschke 3-10 Oscillator
- Welles Wilder Relative Strength Index
- Spread Basis
- Stochastic
- Stochastic RSI
- Weighted Close ( which can be used as input to other indicators )
- Click here for the full listing of Technical Indicators.
Custom Trading Systems

UA offers an advanced analysis system that allows users to write and test custom trading systems. This includes an optimization feature with graphic and numerical results. Use VisualBasic, JScript( like javascript ), or Perl to modify sample programs or write your own trading systems. We offer an open source library of indicators and functions you can use, and modify. We can also assist you in developing a system of your own.
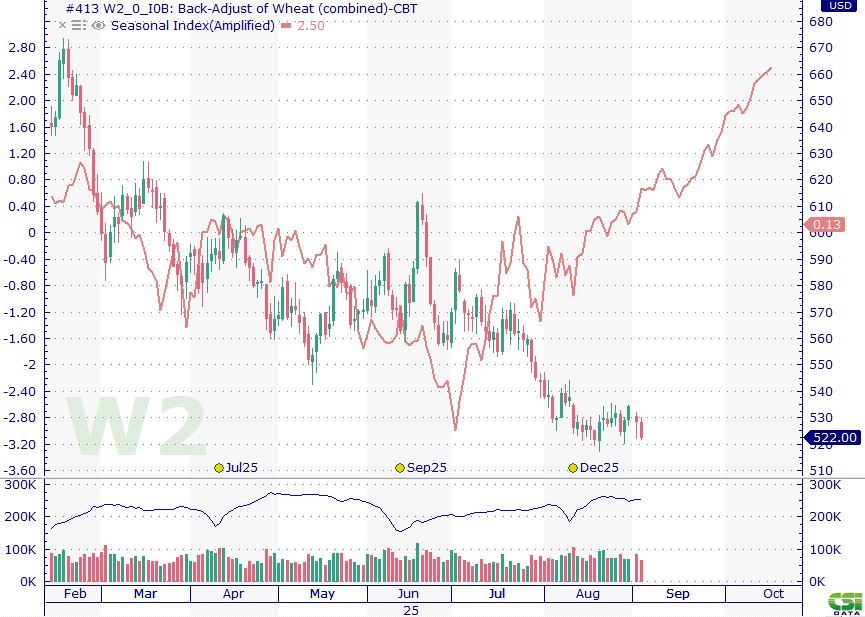
CSI Exclusive Indicators
Seasonal Index
Unlike competitive seasonal tools, UA’s Seasonal Index Study depicts seasonal tendencies by employing forward-looking analysis for individual markets. It is unbiased in that it does not use the future to force the index to appear like the past. UA’s Seasonal Index is cumulative – based upon daily increments of data by adopting a 251-trading-day year. This unique formulation allows it to learn over time. The statistical nature of this study makes it a helpful tool in predicting future market movement.
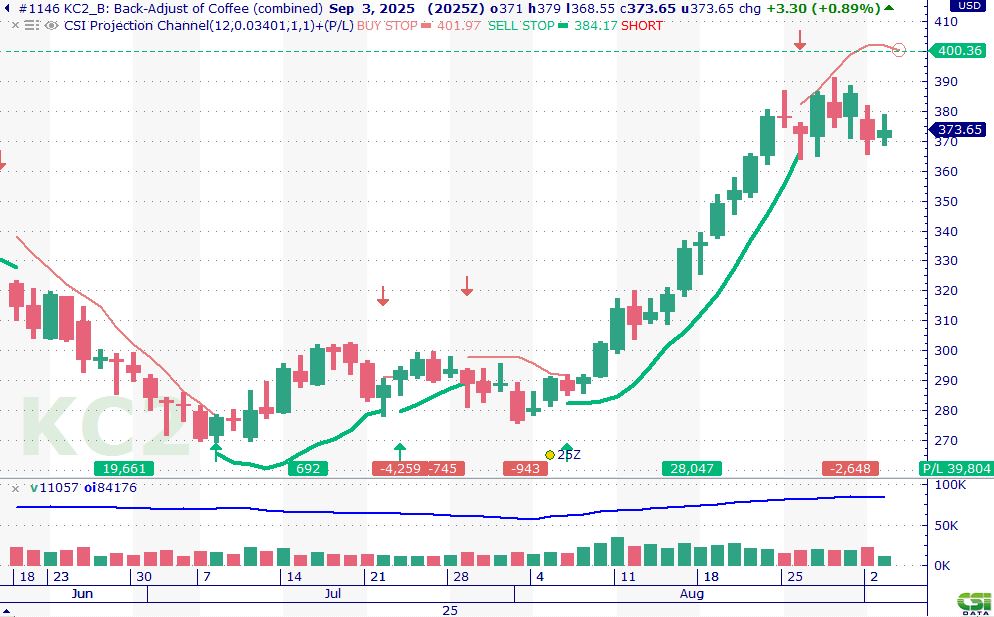
Projection Channel
This indicator is calculated using a volatility algorithm based on Kalman filter technology to produce a channel that acts as support/resistance buy/sell stop levels. When the high penetrates the upper channel, it signals a long position. Likewise, when the low penetrates the lower channel, it signals a short position. When optimized per market, the ATR is set to a reasonable look-back period with the Kalman Theta set to moderate the ATR, producing the most profitable combination that can trade under a customizable Maximum Average Trades Per Year boundary.
Market Facts and Holiday Calendar
A highly informative set of documents is provided within UA, including a Market Factsheet and the Event Calendar. Each of these is accessible through UA’s Database menu. Rare, but important historical facts concerning particular markets are readily available for students of the markets.
- View the online factsheet for a full census of all possible choices that CSI reports. Sort by exchange, CSI number, symbol, name, trading units, trading currency, etc. to uncover important details about the inventory of markets.
- The Holiday Calendar tracks world holidays that may affect any given market.

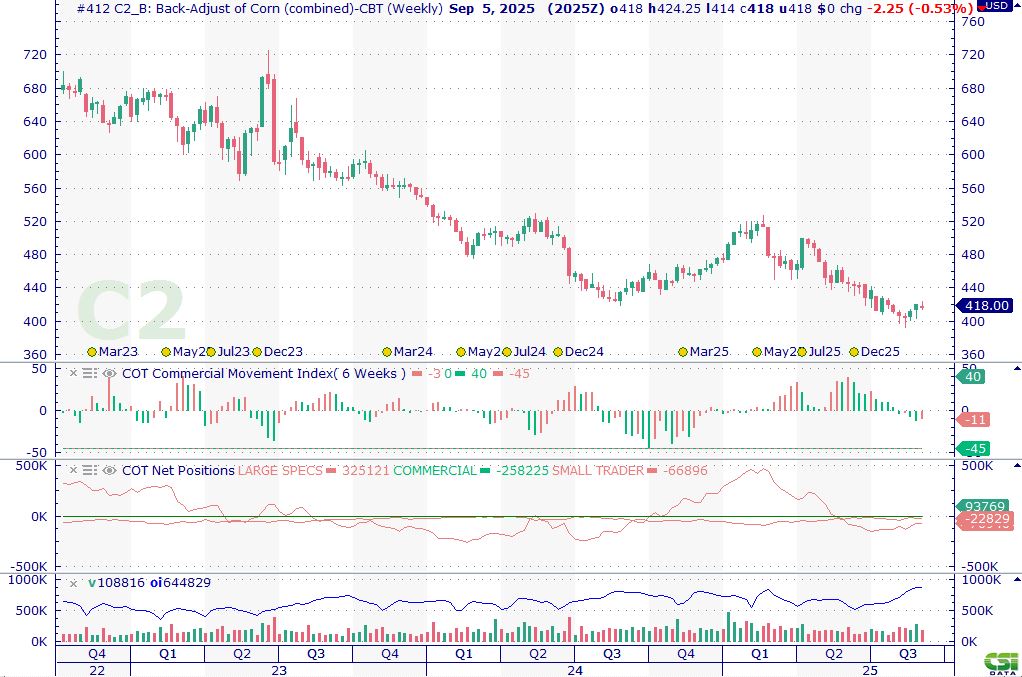
Commitments of Traders (COT)

Commitments of Traders (COT)
Steve Briese, editor of the Bullish Review, has compiled a unique database of the weekly COT data. The CFTC reports on the open interest positions of large and small traders for all regulated commodities, and this market sentiment is known to be an indicator of future market movement that favors the larger commercial interests. Also included are the COT indices Mr. Briese has created for each market to simplify interpretation.
We provide a Continuous Contract Roll Schedule Report for subscribers who use any of our series of Continuous Contracts to monitor Futures markets. It essentially helps you keep track of when to roll your contracts to the next nearest, before the current contract you’re in loses liquidity, and expires.
These daily reports can be generated on demand, or automatically and displayed each time you update. You may reference past generated reports by viewing them in the UA Log viewer, or in files located in the UA\\Logs folder. All roll timing is based on the rules you’ve used when setting up your continuous contracts. Any changes you make will be reflected in future reports.
Color coded fields help you determine which contracts are active and in scope for each symbol, and alert you when it’s time to roll:

Please click here for more details.
Stock Index & Exchange Metrics™

We now offer a way to rank and filter stocks that are contained within Stock Indices, or within Stock Exchanges, giving you a new array of choices to build Ranked Active Stock Portfolios. The tool we provide lets you choose a series of the Top, or Most Active Stocks, or ETFs that trade in exchanges that we follow, or stock index components that we track. You can measure them to obtain the top, or most active 50, 100, 500, 1000, or get metrics on ALL of them if you wish.

You can use these metrics to rank and determine which active stocks to include in your portfolios. And like Stock Index Components, we manage them over time, measuring the exchanges every day, or once a month. And when IPOs accumulate enough history, they will be automatically added to these portfolios, while delisted symbols are removed ( if you’ve set the software to do so ). Active portfolios without metrics will add IPOs immediately on their 1st day of trading. When creating portfolios, you can edit symbols out of the results of the initial scan, based on criteria, and then click Preview results, or click Save As Portfolio.
Click here for more details.
Market Scanner Overview
While you can view dozens of individual charts with indicators to find buy/sell signals, you can also use our Market Scanner to uncover opportunities from 1,000’s of symbols in less than a minute:
You can scan your portfolios, or you can scan an entire exchange, or group of exchanges. You can also scan the individual components of a stock index, like the S&P 500, the NASDAQ 100, the Russell 2000, or dozens of other prominent indices that we track.
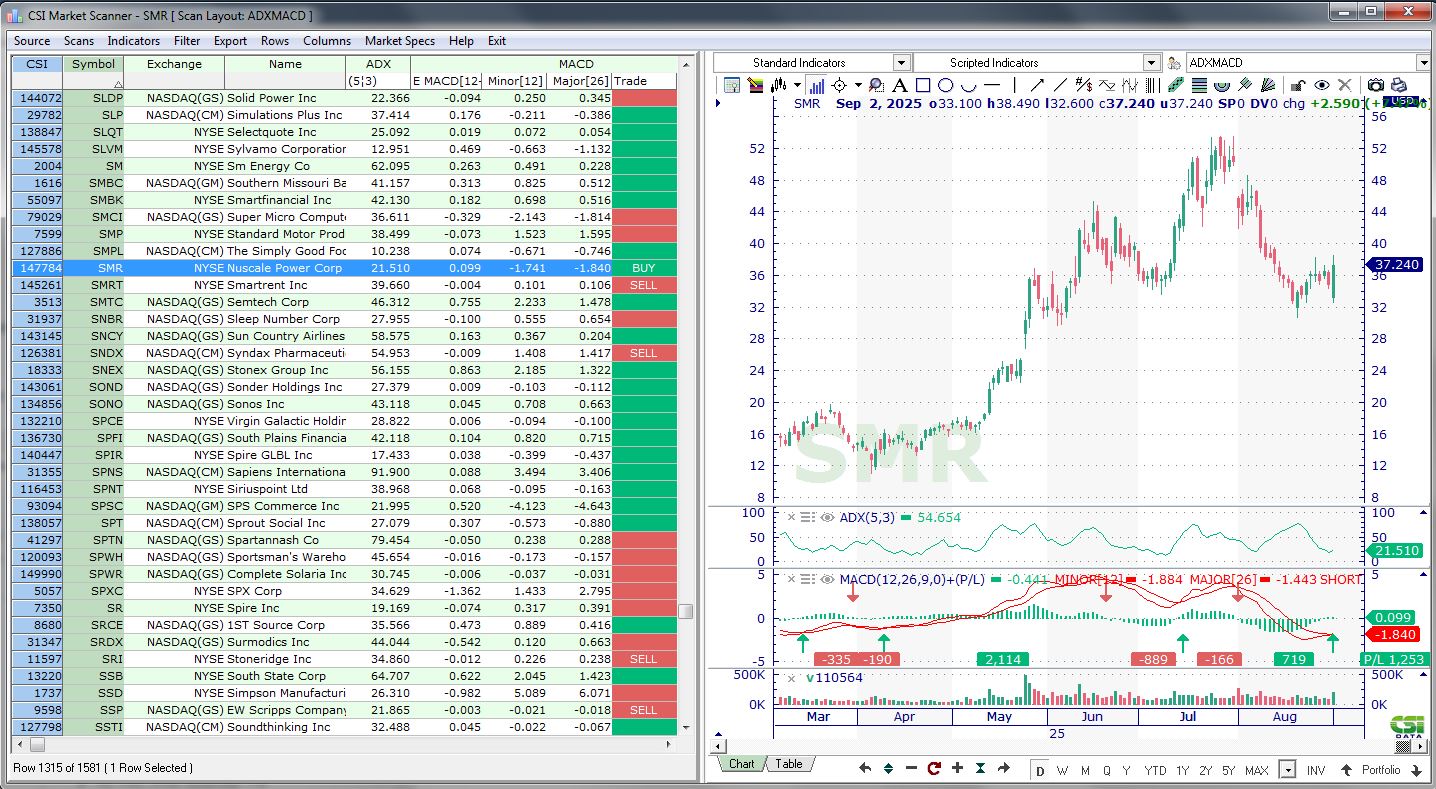
You can add multiple indicators to your scan and sort the table using their results. For instance for indicators that provide a hypothetical P/L over the term defined by the number of bars you’ve loaded, you can sort and filter by that column to find signals for the most profitable symbols according to the indicator, and settings, used:
You can also sort them by Trade signal in order to bring them all together for inspection. You can monitor these from day to day, and add them to your UA portfolio for additional analysis in other technical analysis software.
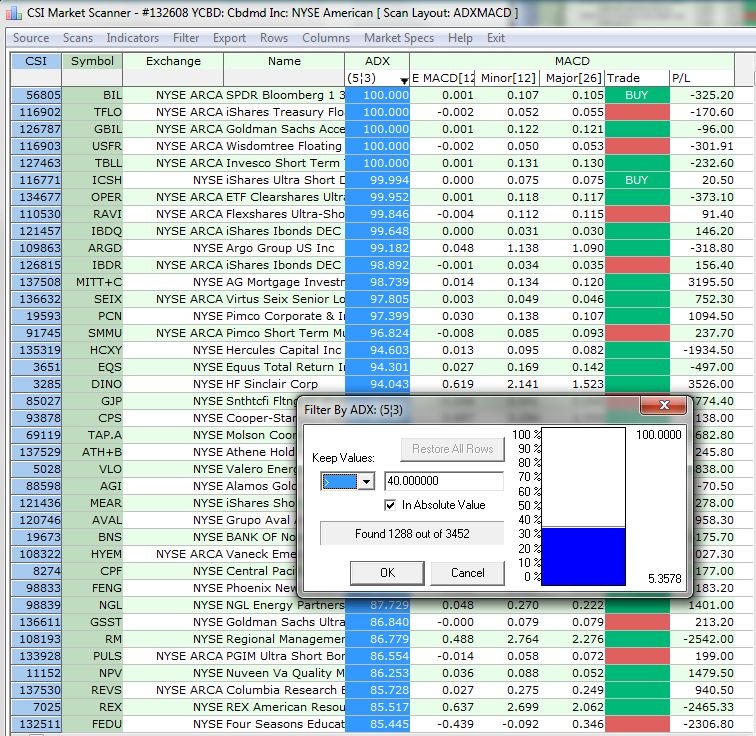
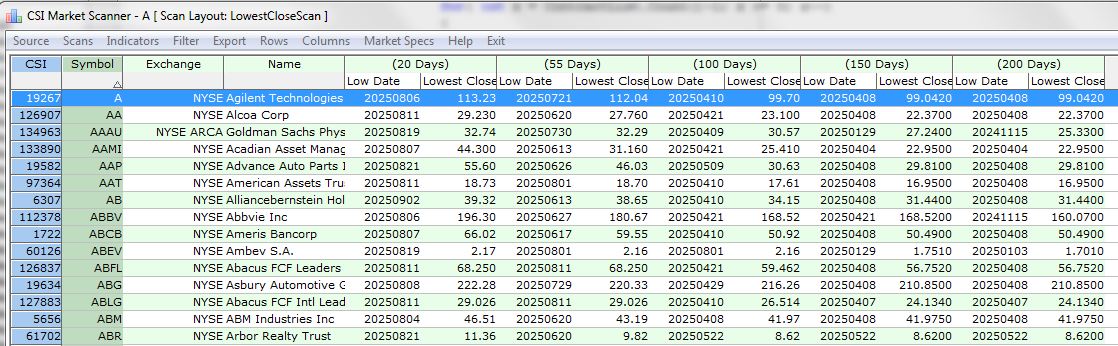
You can capture market statistics on stocks by exchange identification (NASDAQ, NYSE, AMEX, all mutual funds, etc.) to sort and filter them to reveal symbols that meet certain criteria. For example, you might want to reduce a list of stocks down to those that are priced between $10 and $20 per share, or all of those that have just risen over 25% in a single day, or week, or all that have just broken out of a 5 or 10-day low, or high.
Here’s an example showing how to filter out symbols with ADX values of 40 and below:
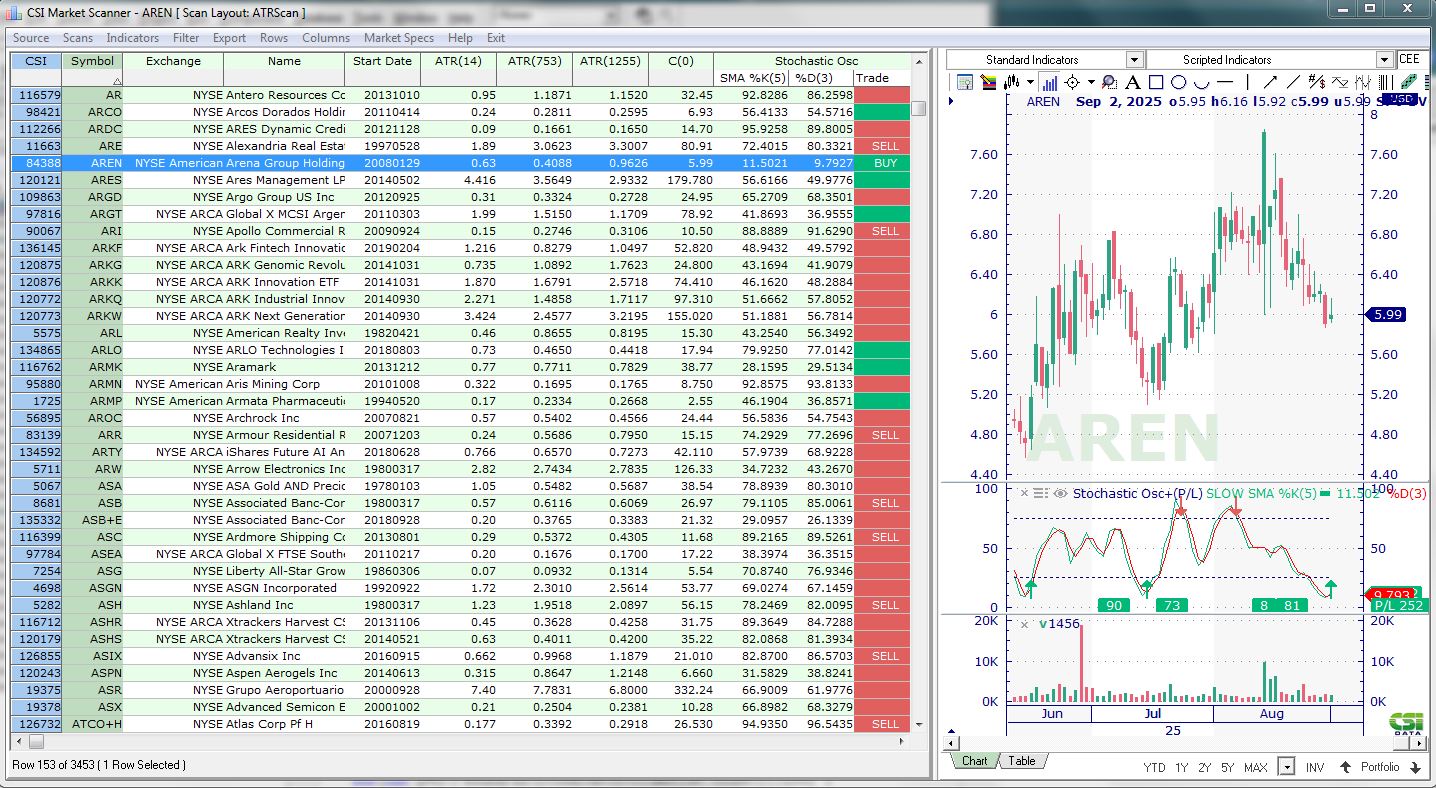
Here is an example of using multiple ATR measurements within a scan to find rising values, along with a Stochastic to indicate over-bought and over-sold conditions:
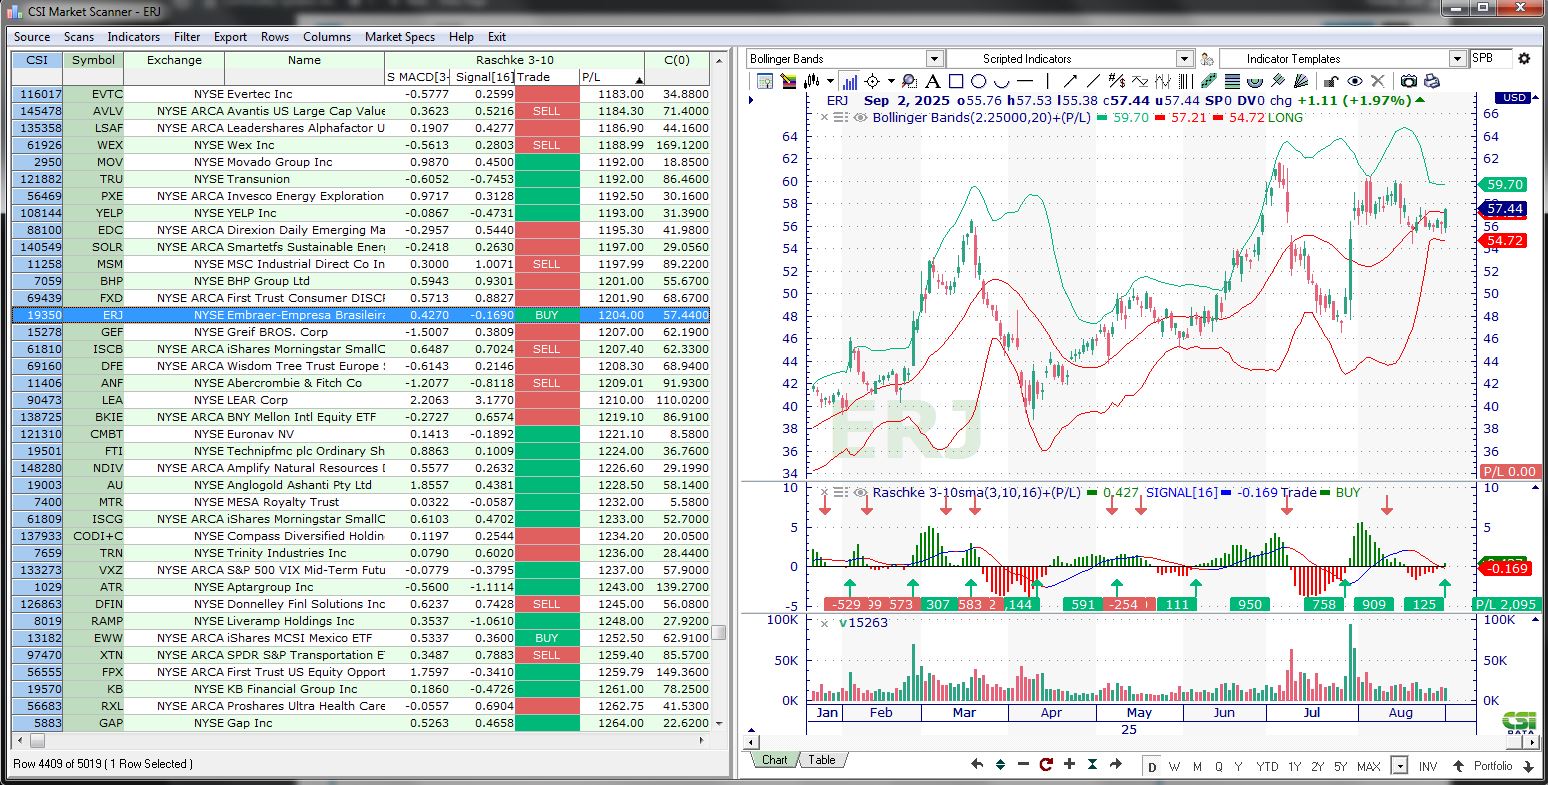
Here’s an example of periodic analysis to reveal potential opportunities, or reversals:
Market Scanner offers a very simple way to examine large volumes of data with relative ease. It also allows you to write your own custom indicators to predict market action. They can be written in VisualBasic, JScript( like javascript ), or Perl, all of which are built into the Market Scanner product. We offer an open source library of indicators and functions you can use, and modify. We can also assist you in developing a system of your own.
Help at Your Fingertips
Please call CSI’s marketing staff to have all your questions answered and to start your subscription today.
We look forward to hearing from you soon!
Call Us

Support is available weekdays 8:30am – 9pm ET.
- Toll Free
- Local Phone
- Fax
- (800) 274-4727
- (561) 392-8663
- (561) 392-7761
Email Us

- Sales
- Support
 |
Order Now |